Enjoy DatePsychology? Consider subscribing at Patreon to support the project.
This article contains data on what constitutes a high “body count” — one’s past number of sexual partners. If you ask people you will get different answers, so of course we can look at the statistics to get a general idea of where attitudes reside. An important finding (perhaps intuitive) I will tell you right away: men and women who have had more sexual partners set a higher limit for what constitutes a high body count. This is an association I have seen replicated across numerous polls and surveys, so I wanted to try and quantify it further here.
I won’t write more of an introduction for this one. However, I would recommend that you read the summary at the bottom of this article first (also a good practice when reading academic papers) before going through the data.
Aside from that, let’s dive right in.
Methods
300 participants were recruited from a social media convenience sample. Participants were asked to indicate their sex, age, their own number of past sexual partners (the colloquial “body count” will be used in this article for this), what they believed a high body count was for men, and what they believed a high body count was for women. Participants were also asked to self-rate their own attractiveness relative to others of their own age and sex.
Results
Of the 300 participants, 62 were women. Men had a mean age of 33.3 (median 31) and women had a mean age of 31.3 (median 32). Table 1 shows descriptive statistics and sex differences for age, perceptions of a high body count in men and women, self-rated attractiveness, and body count of participants. Men and women mostly agreed on what a high body count was for men; the average perception of a high body count for women was similar for men and women, but the median differed by five.

Table 2 shows Pearson correlation coefficients and statistical significance for variables used in the dataset.
Age was positively correlated with a higher perceived high body count in men and women for both men and women. For men, age was correlated with a higher perceived high body count in men, but not for women. Age was also correlated with a higher body count of participants for both men and women. Age was not correlated with self-rated physical attractiveness for either sex.
Men with a higher body count had a higher perceived high body count for men, but not for women (but see the sections below; this changes when we remove leverage points). For women, a higher body count was correlated with a higher perceived body count for both men and women. Higher self-rated attractiveness was correlated with a higher body count for men, but not for women.
For men, higher self-rated attractiveness was correlated with a higher perceived high body count in both men and women. For women, self-rated attractiveness was not correlated with a higher perceived high body count in men nor women.
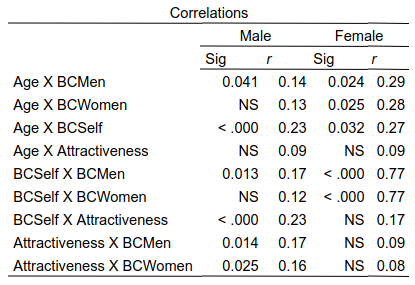
Table 3 shows sexual double standards (SDS) for men and women. Men perceived a high body count in men as being higher than a high body count in women on average. Women showed no evidence of sexual double standards related to body count.

Charts 1 and 2 show correlation matrices for men and women respectively for variables used in this dataset.
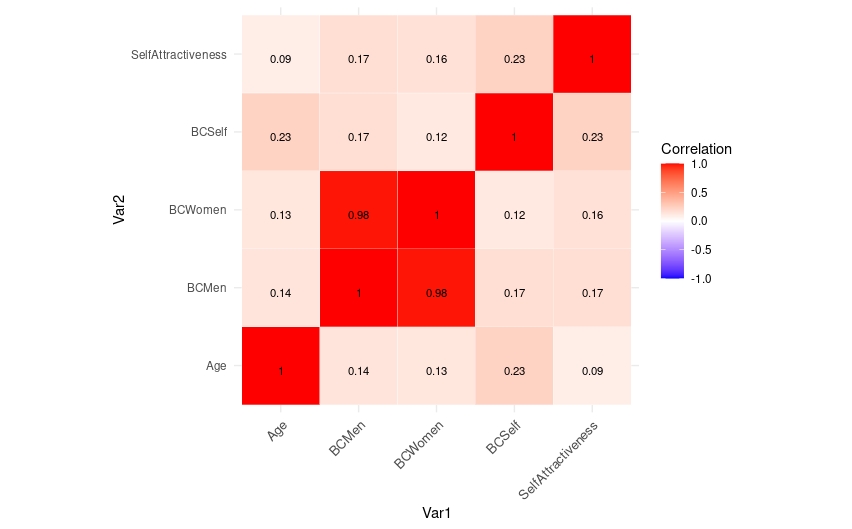
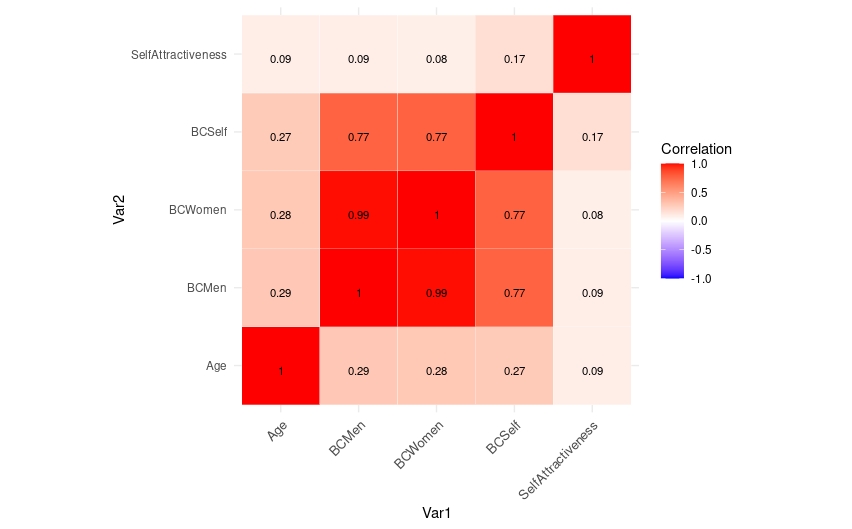
Chart 3 shows the correlation of women’s own body count with a high perceived body count in women.
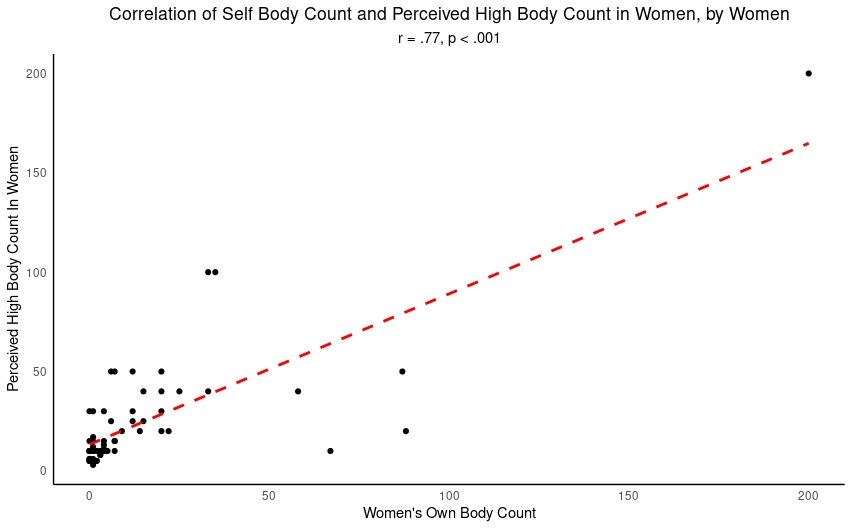
This has an obvious leverage point, so we want to remove that datapoint and redo it (Chart 4):
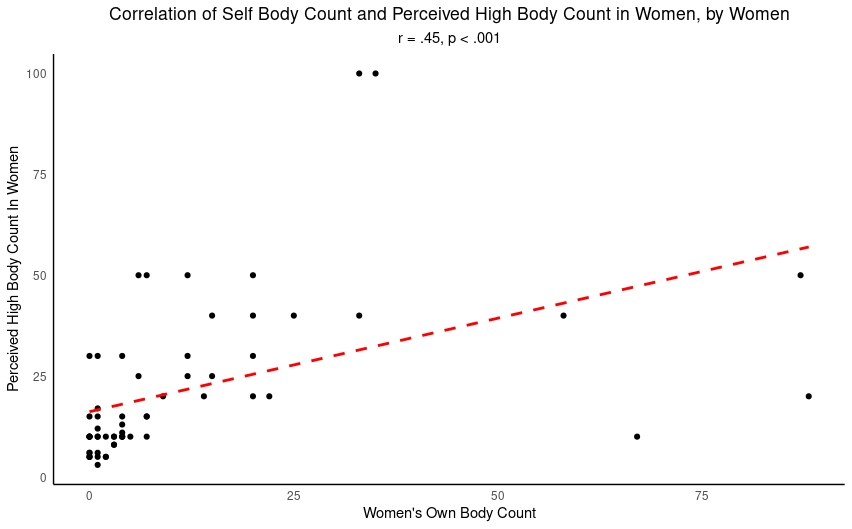
A little bit better, but we can still remove some additional points on the fringes and test it. This leaves us with a more reasonable plot (this also has a high correlation of .65) (Chart 5):
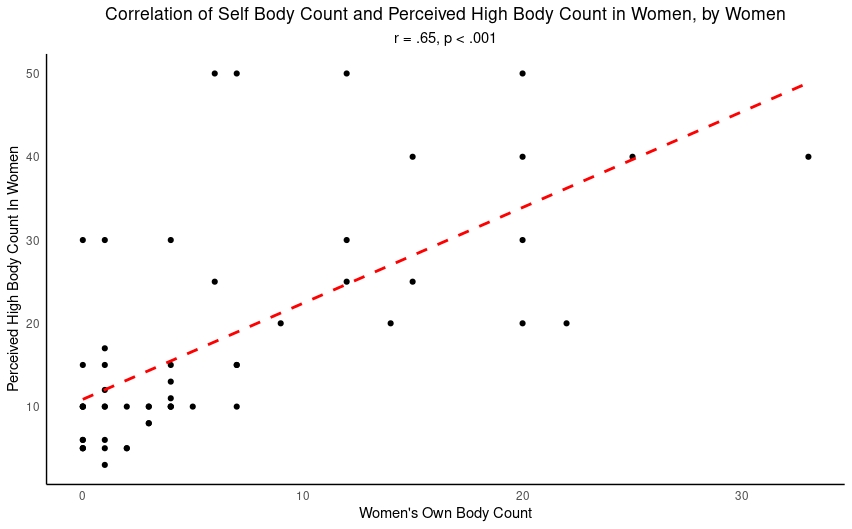
We can also look at this for men. A similar issue of leverage points and an extreme outlier (Chart 6):
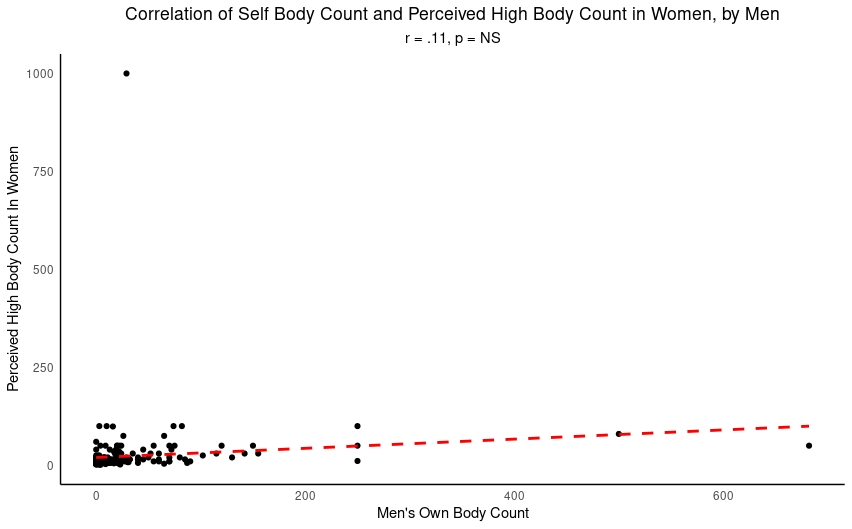
Removing the leverage points and extreme outlier we get a new result. Men with a higher body count themselves have a higher perceived high body count in women (Chart 7):
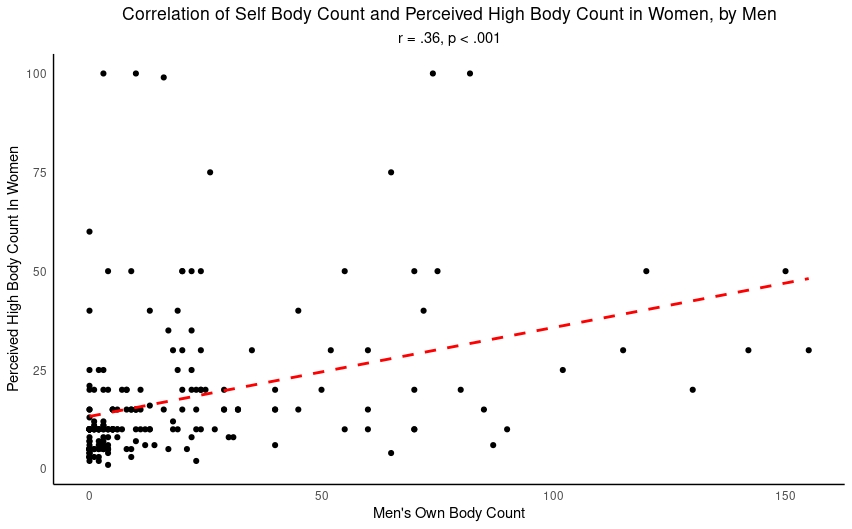
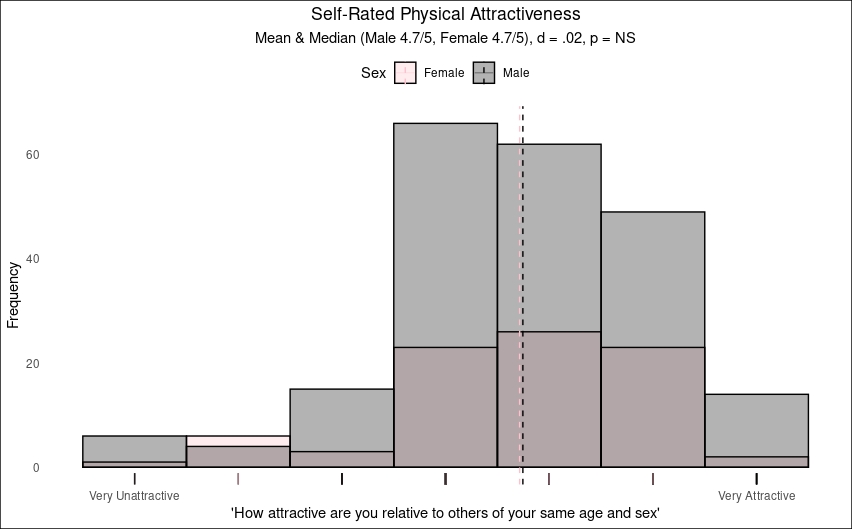
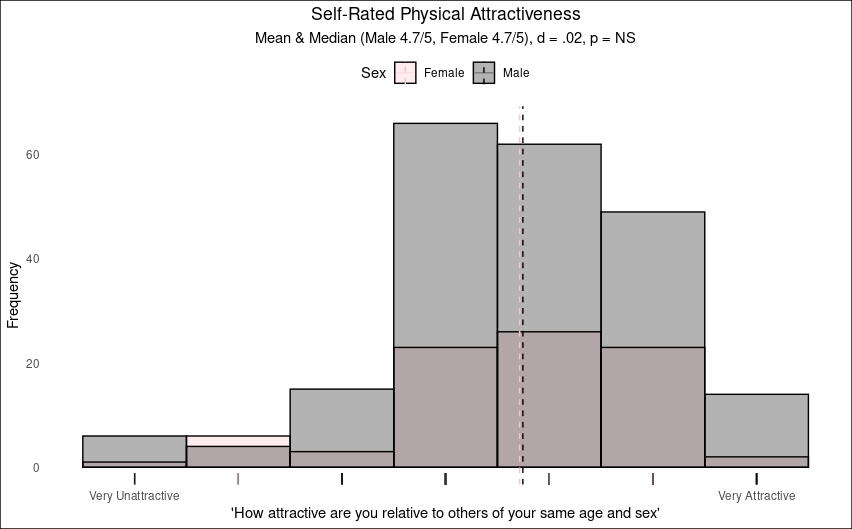
Chart 8 shows us self-rated attractiveness for men and women. No sex differences. Turns out very few people feel like they are below average:
Charts 9 and 10 show the distribution of perceived high body counts in men and women, by sex:
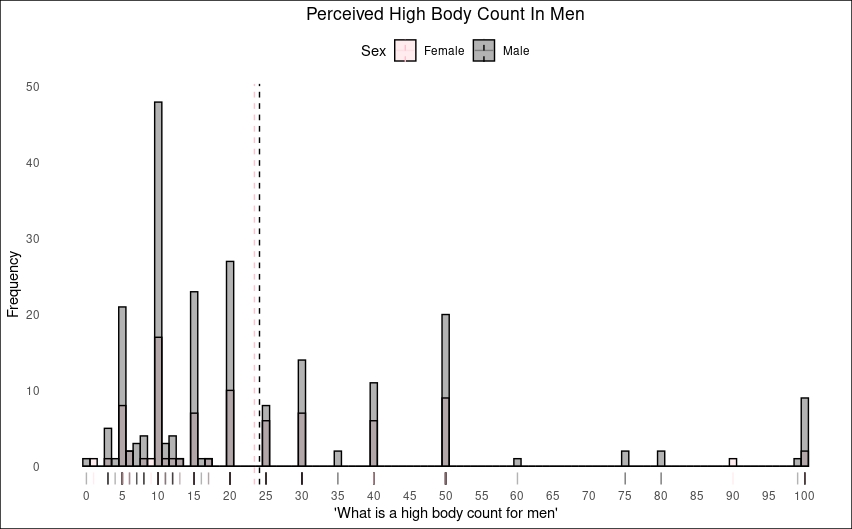
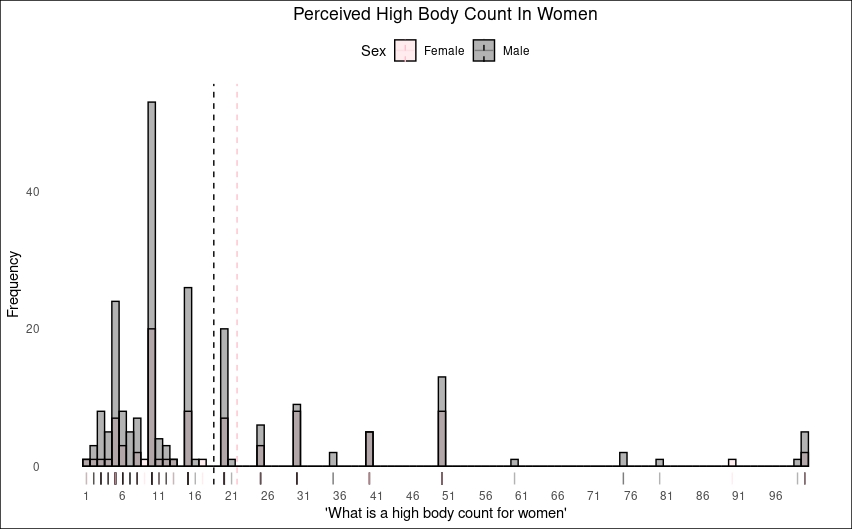
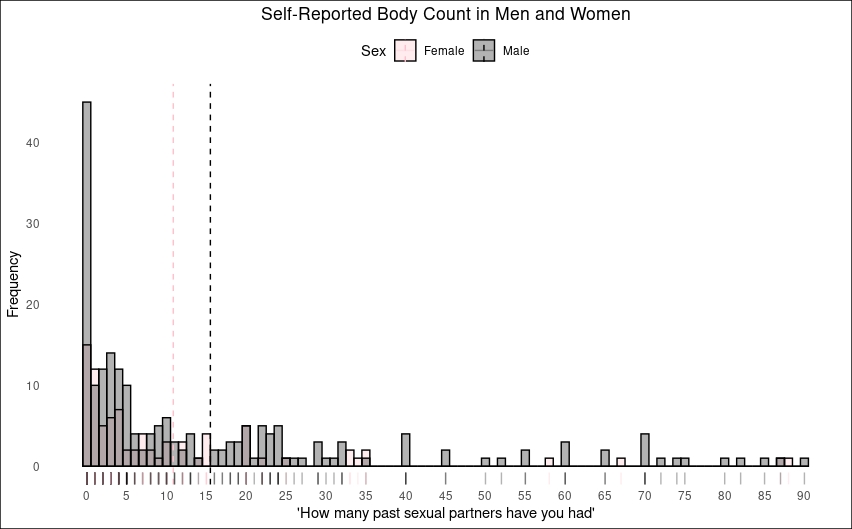
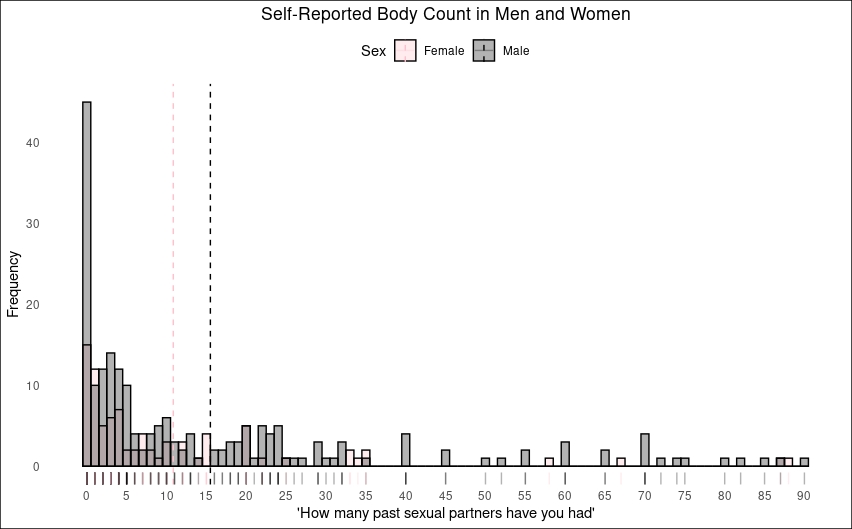
Chart 11 shows the self-reported body count of male and female participants:
Discussion and Result Summary
- Sexual Double Standards (SDS) — some evidence for this in the current dataset. The median high body count for women was lower than it was for men (but only when assessed by men). Men think that a median body count of 15 is high for men while a median body count of 10 is high for women.
- What men and women perceive as a high body count in others is correlated with what their own body count is (and even more strongly correlated for women). This is consistent with my own past data that found men with the least sexual experience had the strongest preference for virgins (see: Who Are The Men That Demand Virgins?).
- Additionally, self-rated attractiveness was associated with a higher perceived high body count in women for men. Together with the self/other high body count association, this is consistent with past research that has found men of higher mate value have a higher tolerance for female promiscuity (for a review see: We Were Patriarchs: Male Mating Strategies and Intrasexual Competition). Simply, men who benefit more from female promiscuity are more tolerant of female promiscuity. These are men who are themselves attractive and promiscuous. It is also likely that there is a congruence of values and assortative selection. Men who don’t mind being promiscuous themselves, men who are more oriented toward short-term mating, and men with low disgust sensitivity may be more tolerant of women with more past sexual partners.
- Median self-reported body counts of participants were very close to representative CDC data (4 for women and 6 for men in the representative CDC figures; 4 and 6 for women and men respectively in the current dataset). Convenience samples and representative data can often converge (see: Twitter Convenience Samples).
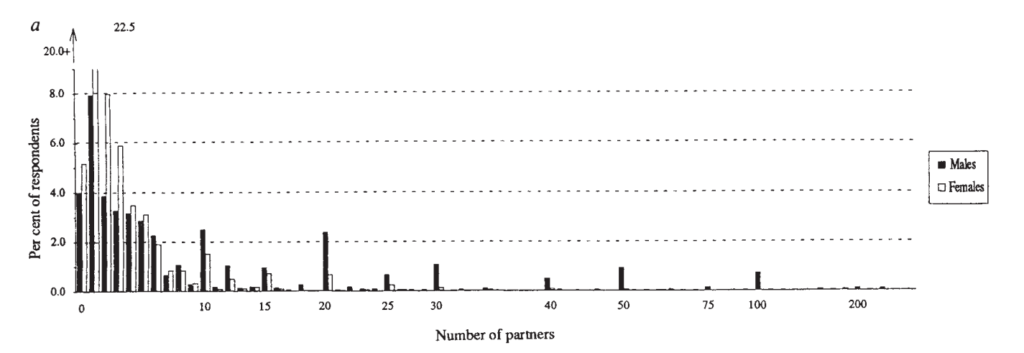
- Men and women were instructed to try and count their exact number of past sexual partners — but only women seem to have done this. Men frequently reported high, round numbers. This is an effect that I wrote about in my second article for DatePsychology (see: Is Self Reported Sexual Partner Data Accurate?). Women use an enumeration strategy, recalling and counting precisely who they have had sex with. Men use a rounding strategy (reporting numbers that end in 5’s and 0’s) even when instructed not to do so. This explains why we don’t see the expected 1:1 ratio in self-reported sexual partner data (men report inaccurately, round, lie up, guess, or engage in some mix of those). Compare Morris (1993) analyzing General Social Survey data with my current dataset below:
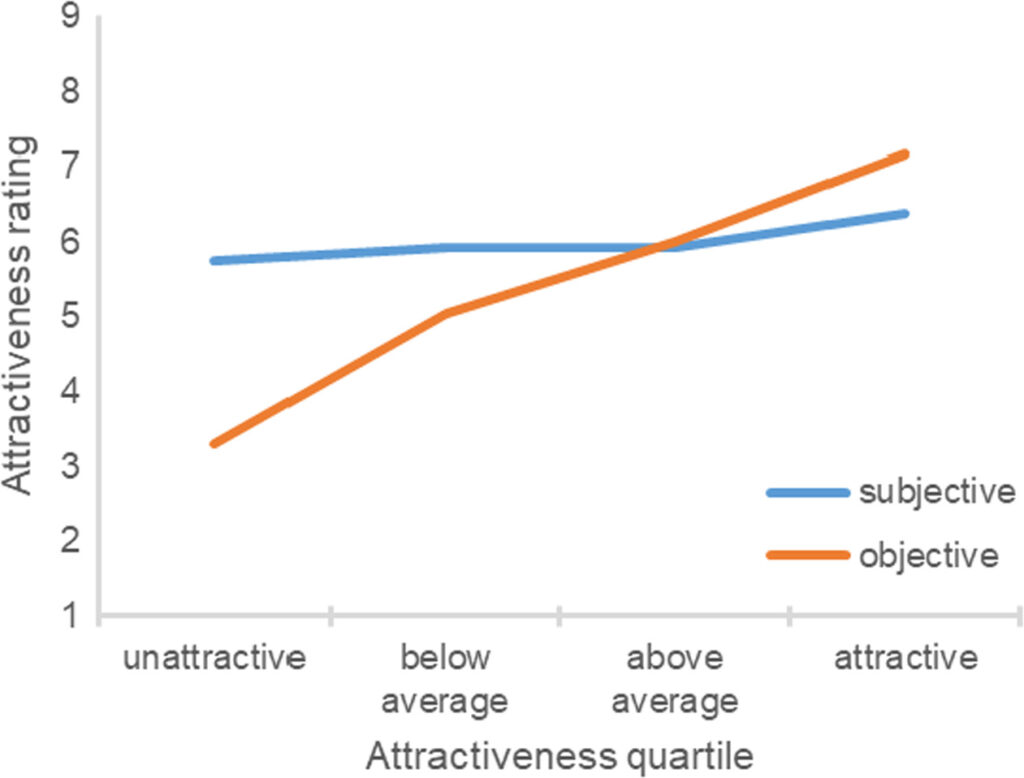
6. Consistent with past research, when asking participants to self-report their own attractiveness, participants consistently rate themselves as average or above. Very few people rate themselves as below average. Everyone is a 6 (on a scale of 10)! Or, in this case, a 5 on a scale of 7. Compare the current results with the results from Greitemeyer (2020) below:
References
Greitemeyer, T. (2020). Unattractive people are unaware of their (un) attractiveness. Scandinavian journal of psychology, 61(4), 471-483.
Morris, M. (1993). Telling tails explain the discrepancy in sexual partner reports. Nature, 365(6445), 437-440.
5 comments
It’s about sociosexuality assortative mating. I know about political religious values are highly assortative like0.4-0.5. I came across a research about sociosexuality.
https://hrcak.srce.hr/file/14205
The self reported sociosexuality correlation is kinda weak like 0.25. However correlation of the partner’s report’s sociosexuality is high like 0.5. So we can tell assortative here here by partner perceived sociosexuality. It’s interesting that assortative self reported sociosexuality is much weaker than partner reported. Sociosexuality of Women self report is lower than partner reported. Whereas sociosexuality of men self report is higher than partner reported. Maybe women tend to think they are not that”slutty” meanwhile men tend to think they are more successful sexually.
Alexandra what’s your opinion about this research?
My words are kinda messed. Let me clear these phrases. Correlation between couples’ self reported sociosexuality is bit weak like 0.25. But correlation between couples’ partner report is very high like 0.5
As far as I’ve read, the study you’ve referenced: “Greitemeyer, T. (2020). Unattractive people are unaware of their (un) attractiveness. Scandinavian journal of psychology, 61(4), 471-483.” is quite unscientific. If there’s a consensus on this, you should be more careful as to what studies you refer to.