Enjoy DatePsychology? Consider subscribing at Patreon to support the project.
The U.S. Census Bureau and the Bureau of Labor Statistics have released the joint annual dataset for the Current Population Survey (CPS), a large nationally representative survey of Americans. Here is my analysis of the data and what it shows us about the relationship between education and relationship outcomes.
Education Predicts Marriage, Divorce, and Singlehood.
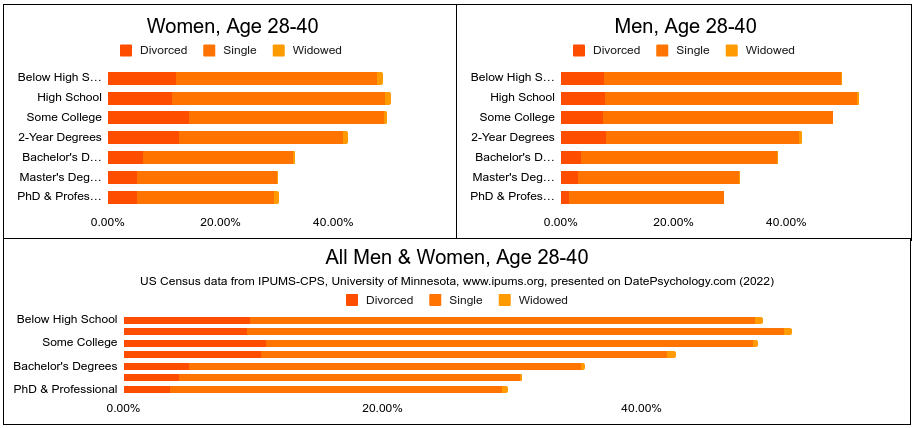
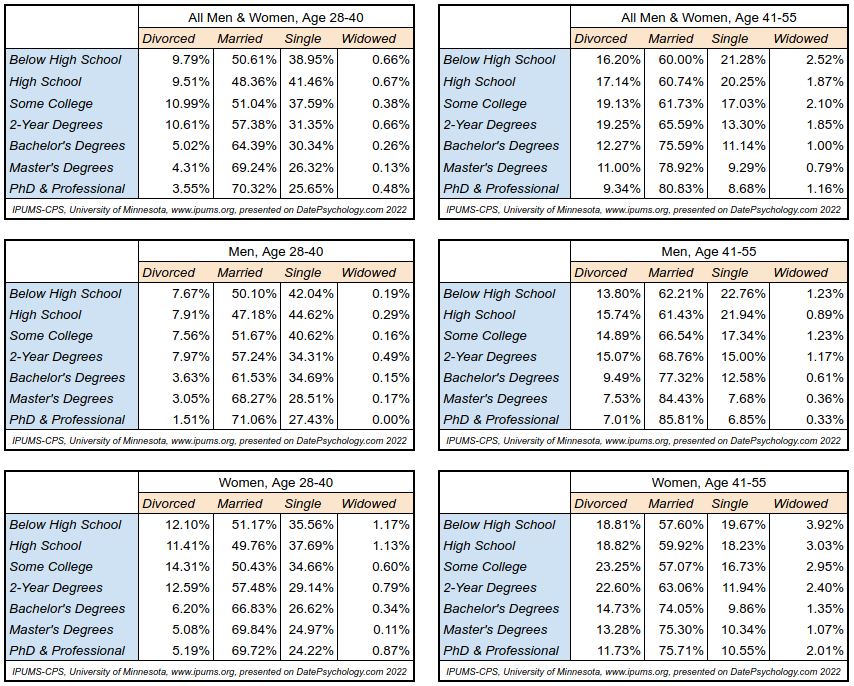
First the data for the age group between 28-40. Very few Americans (only 12.9% per this census) are married before age 28. For both men and women between age 28-40, education level is protective of divorce and singlehood. The higher your level of education, the lower your risk of singlehood, divorce, or spousal death.
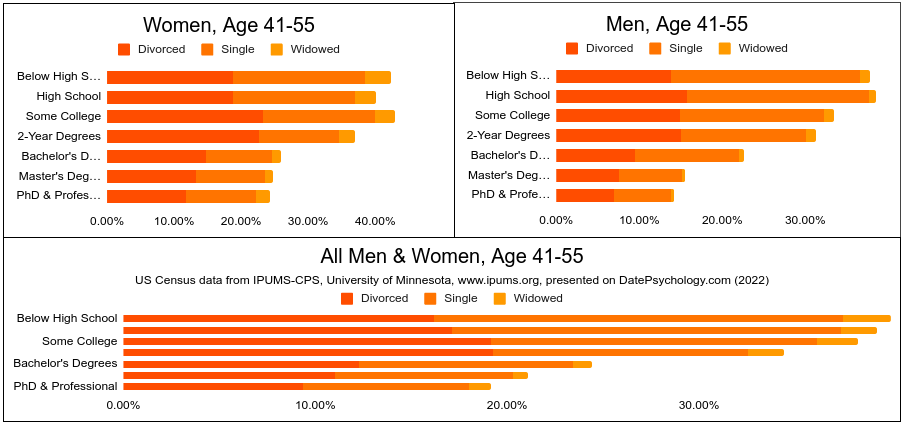
Next is the age group between 41-55. Level of education predicts divorce, singlehood, and widowhood. The pattern holds for men and women.
The difference is large between the most educated and least educated groups. 21% of men with a high school education will remain single into their 40s. Only 7% of men with a Master’s degree or Doctorate will remain single into their 40s.
Educated Women, Their Cats and Perpetual Loneliness
There is a misconception that women with careers end up alone. Alternatively, a misconception that educated women are more prone to divorce. This does not seem to be the case. Education level is as protective for the relationships of women as it is for men.
There are many reasons why this may be, which I will explore further in this article. But first, let’s see what the current CPS data can tell us about another meme in dating discourse.
The Wall
The Wall — a meme of the manosphere that roughly asserts women become undesirable around age 30 and struggle to find relationships past that point. Indeed, human beings do become less physically attractive as we age (Henss, 1991; Mathes et al., 1985). If that were where the meme of The Wall ended it would not be worth mentioning.
Where the meme loses the plot is when it morphs into the belief that there is a large cohort of single women in their 30s. After all, if women suddenly decline in mate value, surely there must be more single women post-30? You know, the women with the PhDs and cats?
As we have seen from the data here, the PhD part isn’t true. Women with PhDs are the least likely to be single in their 30s, 40s and 50s. The ruling is still out on cats. Do we see more single women in this age group as a result of The Wall?
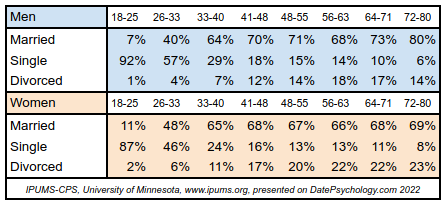
Here are singles, by sex and age:
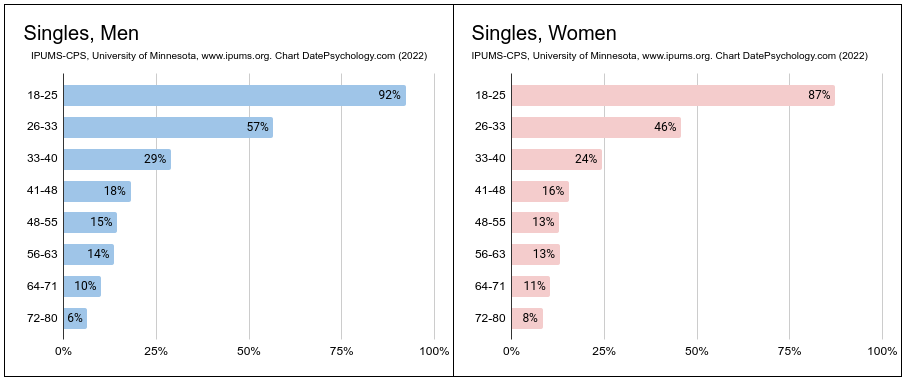
The trend that older women are more likely to be married is also true for men. In fact, men are more likely to be single across every age group until age 72.
In addition, the trend is also true for unmarried relationships and for sex (General Social Survey, see “How Many Sexual Partners Did Men and Women Have in 2021?”). The youngest cohort of both men and women is the least likely to be in a relationship and the least likely to have had sex within the last year.
Is there any truth to The Wall at all? Well, young women are rated as more facially attractive and this does decline as with age (Tatrunaite, 2005). Hypotheses in evolutionary psychology also posit that young women should have higher mate value (Buss, 1989).
You must decide if that is more convincing than watching what people do, not what people say — as the behavioral maxim goes. The youngest cohort of both men and women is much more likely to be single, sexless, and struggling to find a relationship. 30-year-old men and women are more likely to be in relationships, more likely to be married, and more likely to be having regular sex.
Mate value may decline (or not), but it does not seem to be a barrier to relationship formation. Rather than an impassible wall, a speed bump might be a more apt metaphor.
On that note, let’s look at some factors that may help explain why the most educated people make the most desirable mates.
Personality Traits That Facilitate Education Also Facilitate Relationships
In popular thought, the first trait people tend to link with educational attainment is intelligence. The relationship between intelligence and level of educational attainment is linear (McGue et al., 2022) and high intelligence also predicts lower rates of divorce (Holley et al., 2006). However, personality traits may contribute to educational success even more than intelligence (Cerni et al., 2021; Haider & von Stumm, 2022). The traits that predict educational success also predict lower likelihood of divorce. The Big Five model is a good place to start.
Agreeableness is a Big Five personality trait related to cooperation and prosocial behavior. It is a stronger predictor of university success than intelligence (Nieuwenhuis, 2018). The relationship between agreeableness and academic performance may be twice the magnitude of the relationship between intelligence and academic performance (Furnham & Monsen, 2009).
Agreeableness is a trait closely associated with attractiveness as well. A great deal of research has been done showing a link between prosocial behavior and attractiveness; much has examined the Big Five trait of Agreeableness alongside these (for a review see: Miller, 2007). Not only does Agreeableness predict relationship quality (Holland & Roisman, 2008; Mousavi, 2017; Watson et al., 2000), thus staving off divorce (Solomon & Jackson, 2014), it also predicts perceptions of physical attractiveness (Brown et al., 2018; Meier et al., 2010).
Conscientiousness is another trait that has medium-large relationships with both academic success and relationship outcomes. Conscientiousness describes an individual disposition for duty and diligence. It is negatively associated with antisocial personality traits, like those found in the Dark Triad (Jakobwitz, 2006; Vernon et al., 2008), or clinical Cluster B personality disorders (Daurio et al., 2022; Hong-Hua et al., 2006; Widger et al., 2019).
Similar to Agreeableness, Conscientiousness predicts positive life outcomes that converge: higher educational attainment, better grades in school, higher self control, higher job income, better physical health, higher relationship satisfaction, higher relationship commitment, and lower rates of divorce (Jackson & Roberts, 2007).
I give these personality traits from the Five Factor Model as major examples of how personality intersects with academic performance and relationship outcomes. It is not by any means an exhaustive list. You can probably imagine many more.
Assortative and Hypergamous Mating for Education
Assortative mating is the tendency to select partners who are similar to you. Personality, physical attractiveness, level of education, and more — we select partners who are similar to us. In some cases this is an explicit preference (wanting a partner with shared interests; meeting through shared hobbies) while in others it is forced (everyone wants a beautiful partner, but most people end up with someone of similar physical attractiveness).
Your dating pool comes from your immediate environment (even given the popularity of online dating) and this will contribute to assortative effects. Many relationships are formed in the university or in some environment related directly to your level of education (like work). Young people who attend college often move to new locales for college, where their pool (even on apps) contains more educated people.
Women also prioritize mates who have higher levels of education than they do — hypergamous selection. If given a choice, all things being equal, women will pick men with a higher level of education. Education level is one of the most robust status cues in the West (Buss et al., 2020).
The point is that mate selection is not random. The protective associations of education for relationships often occur in both partners. Who you marry will determine your potential for divorce as much as your own behavior will.
The current CPS data cannot tell you if the risk of divorce is additive. Interactions could mean mixed marriages have higher or lower risks than the sum of the risks of two individuals. However, past research on divorce and education indicates that it is (Lyngstad, 2004). The divorce risk for two PhD holders is about 15%, consistent with the individual risk of 7-8% for individual PhD holders.
Protective Effects of Education: Causation vs Correlation
It’s tempting to conclude from this kind of data that education has a causal effect on marital outcomes. This is often where the mind first goes — that you can reduce your divorce risk by getting a PhD. Unfortunately, we can’t assume that. Given the nature of a long-term university education it would also be difficult to design an experiment where we could show causality: random assignment of individuals into “go to school for 10 years” and “don’t go to school” groups.
That said, I suspect there are both causal and correlative effects.
Examples of effects due to association, as described above, are those related to personality. Personality is considered to be stable (Damian et al., 2019), so unfortunately it does not change much. That’s the personality blackpill. It is heritable (Vukasović & Bratko, 2015) and to some extent you are stuck with what you’ve got.
“Just choose to get a PhD bro” or “just marry a doctor bro-ette” isn’t equally realistic for everyone. Due to individual differences, not everyone will make it in higher education. Nor will everyone have equal exposure to a pool of highly educated mates.
At the same time, personality does seem to change a little bit over the lifetime (Chopik & Kitayama, 2018) and in response to experiences — including university education (Kassenboehmer, 2018). It isn’t unreasonable to believe that 10 years of education could have lasting effects on your personality.
Both causal and correlative is the relationship between income, education and relationship outcomes. Individuals who are more affluent are more likely to go to college, while education level also directly contributes to your future income and your level of affluence. This is important, because economic problems are a contributor to divorce. Avoiding poverty is a big part of the picture and a similar article could be written on income and relationships.
You can probably hypothesize many things that are associated with education level that will help explain some of the variance in the relationship. Would it surprise you to learn that a higher education level predicts lower rates of domestic abuse (a top reason cited for divorce; Scott et al., 2013), or that people with PhDs are less likely to be in prison? Probably not.
A lot of this can be boiled down to good decision-makers versus bad decision-makers. Clusters of traits and behaviors that predict the path your life will take.
Methodology Note
“Single” in this dataset refers only to never-married single men and women. As such it will overestimate the number of singles (people not in relationships at all; many never-married “Singles” will be in a relationship). This is independent of Divorced, so Single in this dataset does not overlap with Divorced.
“Married” combines the variables Married (Spouse Together) and Married (Spouse Absent). Married (Spouse Absent) represents approximately 2% of the total Married population. “Divorced” combines the “Divorced” and “Separated” variables, so it includes couples that are broken-up but not formally divorced.
Additional Tables
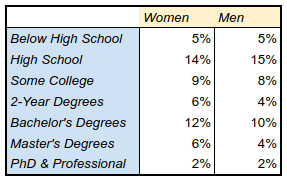
I did not perform an analysis on education and singlehood between age 18-27. This is because most people are single at this age and only 1.5% are divorced. In this section I provide tables with data from the charts provided in the sections above.
In addition, in this section are two additional tables showing simply: level of education completed by gender and marital status by gender.
References
Buss, D. M. (1989). Sex differences in human mate preferences: Evolutionary hypotheses tested in 37 cultures. Behavioral and brain sciences, 12(1), 1-14.
Buss, D. M., Durkee, P. K., Shackelford, T. K., Bowdle, B. F., Schmitt, D. P., Brase, G. L., … & Trofimova, I. (2020). Human status criteria: Sex differences and similarities across 14 nations. Journal of Personality and Social Psychology, 119(5), 979.
Buss, D. M., Goetz, C., Duntley, J. D., Asao, K., & Conroy-Beam, D. (2017). The mate switching hypothesis. Personality and Individual Differences, 104, 143-149.
Brown, M., Sacco, D. F., & Medlin, M. M. (2019). Sociosexual attitudes differentially predict men and women’s preferences for agreeable male faces. Personality and Individual Differences, 141, 248-251.
Cerni, T., Di Benedetto, A., & Rumiati, R. I. (2021). The contribution of personality and intelligence toward cognitive competences in higher education. Frontiers in Psychology, 12, 2566.
Chopik, W. J., & Kitayama, S. (2018). Personality change across the life span: Insights fr
Damian, R. I., Spengler, M., Sutu, A., & Roberts, B. W. (2019). Sixteen going on sixty-six: A longitudinal study of personality stability and change across 50 years. Journal of Personality and Social Psychology, 117(3), 674.
Daurio, A. M., & Taylor, J. (2022). An investigation of the triarchic model of psychopathy and self-reported Cluster B personality disorder traits. Personality Disorders: Theory, Research, and Treatment, 13(2), 153.
Furnham, A., & Monsen, J. (2009). Personality traits and intelligence predict academic school grades. Learning and individual differences, 19(1), 28-33.
Haider, Z. F., & von Stumm, S. (2022). Predicting educational and social–emotional outcomes in emerging adulthood from intelligence, personality, and socioeconomic status. Journal of Personality and Social Psychology.
Henss, R. (1991). Perceiving age and attractiveness in facial photographs 1. Journal of Applied Social Psychology, 21(11), 933-946.
Holland, A. S., & Roisman, G. I. (2008). Big Five personality traits and relationship quality: Self-reported, observational, and physiological evidence. Journal of Social and Personal Relationships, 25(5), 811-829.
Holley, P., Yabiku, S., & Benin, M. (2006). The relationship between intelligence and divorce. Journal of Family Issues, 27(12), 1723-1748.
Hong-Hua, Y., Wen-Qing, F., & Shu-Qiao, Y. (2006). Symptomatology of Cluster-B Personality Disorders from the Five-Factor Model Perspective. Chinese Mental Health Journal.
Jackson, J. J., & Roberts, B. W. (2017). Conscientiousness.
Jakobwitz, S., & Egan, V. (2006). The dark triad and normal personality traits. Personality and Individual differences, 40(2), 331-339.
Kassenboehmer, S. C., Leung, F., & Schurer, S. (2018). University education and non-cognitive skill development. Oxford Economic Papers, 70(2), 538-562.
Lyngstad, T. H. (2004). The impact of parents’ and spouses’ education on divorce rates in Norway. Demographic research, 10, 121-142.
Mathes, E. W., Brennan, S. M., Haugen, P. M., & Rice, H. B. (1985). Ratings of physical attractiveness as a function of age. The Journal of Social Psychology, 125(2), 157-168.
McGue, M., Anderson, E. L., Willoughby, E., Giannelis, A., Iacono, W. G., & Lee, J. J. (2022). Not by g alone: The benefits of a college education among individuals with low levels of general cognitive ability. Intelligence, 92, 101642.
Meier, B. P., Robinson, M. D., Carter, M. S., & Hinsz, V. B. (2010). Are sociable people more beautiful? A zero-acquaintance analysis of agreeableness, extraversion, and attractiveness. Journal of Research in Personality, 44(2), 293-296.
Miller, G. F. (2007). Sexual selection for moral virtues. The Quarterly review of biology, 82(2), 97-125.
Mousavi, R. (2017). Relationship between Big Five personality factors neuroticism, extraversion, agreeableness, openness, loyalty and marital adjustment. NeuroQuantology, 15(4).
Nieuwenhuis, J. (2018). The interaction between school poverty and agreeableness in predicting educational attainment. Personality and Individual Differences, 127, 85-88.
Tatarunaite, E., Playle, R., Hood, K., Shaw, W., & Richmond, S. (2005). Facial attractiveness: a longitudinal study. American Journal of Orthodontics and Dentofacial Orthopedics, 127(6), 676-682.
Sarah Flood, Miriam King, Renae Rodgers, Steven Ruggles, J. Robert Warren and Michael Westberry. Integrated Public Use Microdata Series, Current Population Survey: Version 10.0 [dataset]. Minneapolis, MN: IPUMS, 2022. https://doi.org/10.18128/D030.V10.0
Scott, S. B., Rhoades, G. K., Stanley, S. M., Allen, E. S., & Markman, H. J. (2013). Reasons for divorce and recollections of premarital intervention: Implications for improving relationship education. Couple and Family Psychology: Research and Practice, 2(2), 131.
Solomon, B. C., & Jackson, J. J. (2014). Why do personality traits predict divorce? Multiple pathways through satisfaction. Journal of Personality and Social Psychology, 106(6), 978.
Vernon, P. A., Villani, V. C., Vickers, L. C., & Harris, J. A. (2008). A behavioral genetic investigation of the Dark Triad and the Big 5. Personality and individual Differences, 44(2), 445-452.
Vukasović, T., & Bratko, D. (2015). Heritability of personality: A meta-analysis of behavior genetic studies. Psychological bulletin, 141(4), 769.
Watson, D., Hubbard, B., & Wiese, D. (2000). General traits of personality and affectivity as predictors of satisfaction in intimate relationships: Evidence from self‐and partner‐ratings. Journal of personality, 68(3), 413-449.
Widiger, T. A., Sellbom, M., Chmielewski, M., Clark, L. A., DeYoung, C. G., Kotov, R., … & Wright, A. G. (2019). Personality in a hierarchical model of psychopathology. Clinical Psychological Science, 7(1), 77-92.
2 comments
There is a small but important error in this paper. It is this sentence: [Agreeableness] “is a stronger predictor of university success than intelligence (Nieuwenhuis, 2018).” No, no, a thousand times no! At the outset, I want to say that I’ve enjoyed reading your work and Twitter threads. I can infer from many of your comments that many criticisms concern you work on gender differences and claims of the “Manosphere.” This (obviously) does not concern that. It does, however, make a claim that is not only unsupported by the cited paper but also inconsistent with one of the most solid and well-replicated results in psychology. If you can send me an email address, I can provide details and more citations, but here is a very brief summary: (1) the Nieuwenhuis paper does not address the role of intelligence in educational success, much less conclude that agreeableness is a stronger predictor of such success; (2) intelligence is a stronger predictor of educational success (achievement and duration) than any of the big five personality factors, including conscientiousness; and (3) the role of agreeableness in educational success is legitimately controversial and not as well-studied as intelligence, and it *probably* is positive but only modestly so – not nearly as important as intelligence!
“The Wall” may be real, but having a different effect than the meme you describe: If women begin to notice a decrease in their own attractiveness at the end of the 20s, while men become more attractive at same age, this may cause marriage. If men and women’s subjective sense of their own attractiveness intersects at that age, marriage may tend to occur at that age because both parties feel they’re getting the best partner they are likely to find.