Enjoy DatePsychology? Consider subscribing at Patreon to support the project.
A quick introduction — if you don’t know what a normal distribution is, here:
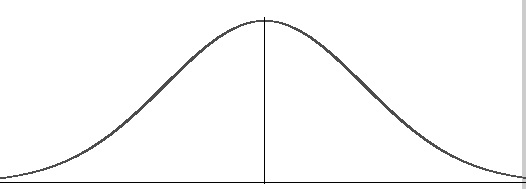
A normal distribution is the above arrangement of data with a symmetrical distribution around the mean. Also called a bell curve, because we see a symmetrical layout of data around the mean similar to a bell.
Normal distributions occur frequently in nature. For example, height is a natural example that falls on a normal distribution.
The central limit theorem, which I described in a previous article on how to know if a sample size is too small, also lets us use assumptions of normality even when populations are not normally distributed.
And populations are often not normally distributed.
The confusion arises here
Because normal distributions occur in nature and because we make assumptions about normal distributions in statistical tests, many people erroneously begin to believe that we should assume any given trait in a population is normally distributed. It is simply assumed that a population is actually, truly, in-real-life, normal.
Then when a sample shows up as a skewed distribution the same people may believe that something went wrong.
How do we know if a population is normally distributed
Since the central limit theorem explains how samples give us normal distributions from non-normal populations, we can’t just look at the normal distribution of a sample and assume that a population has a normal distribution.
At the same time, we usually can’t measure an entire population.
Fortunately we have statistical tests for normality. Normality tests can indicate if our sample data came from a population with a normal distribution or not. The Shapiro-Wilk test is the most common normality test. Here is a website with a few more common normality tests.
That is all that I have to say about normality tests for this article. The point I want you to take home from this section is this: we can’t know if a population has a normal distribution just by looking at the graph of a sample distribution.
Is attractiveness normally distributed
As of this writing, most research on physical attractiveness (and other measures of attractiveness) that I have read shows normal distributions in its samples. There is one big exception:
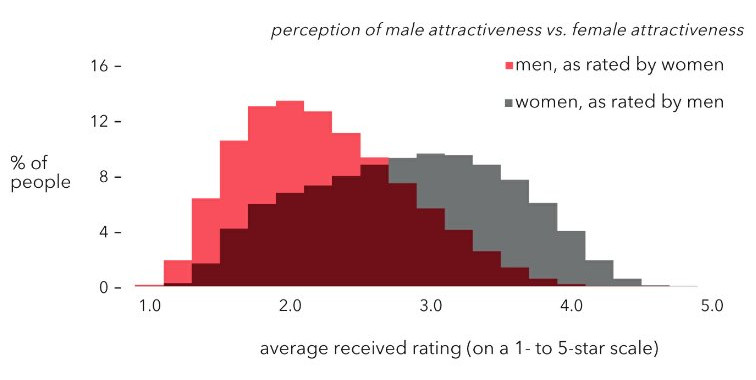
This is the dataset from Christian Rudder. Rudder founded the dating website, later the app by the same name, OKCupid. As a founder he had full access to the data and published it in his book Dataclysm.
Here we see that men rated women along a normal distribution, but women rated men in a skewed distribution.
I have seen this interpreted as “women are wrong” and that women “should” rate men along a normal distribution as men do for women.
This is based in part, as I said in the previous sections, on an erroneous assumption of normality. We don’t know that male attractiveness in the population should follow a perfect normal or Gaussian distribution. There is no rule that it should, nor that we should expect it to be so, be it in statistics, logic or anywhere else.
Confusing a scale midpoint with a sample mean
The “women estimate incorrectly” interpretation also seems to rely on mistaking the scale midpoint with the mean of the sample. Because the midpoint of the scale is 3 it is assumed that the sample average should therefore fall on the three.
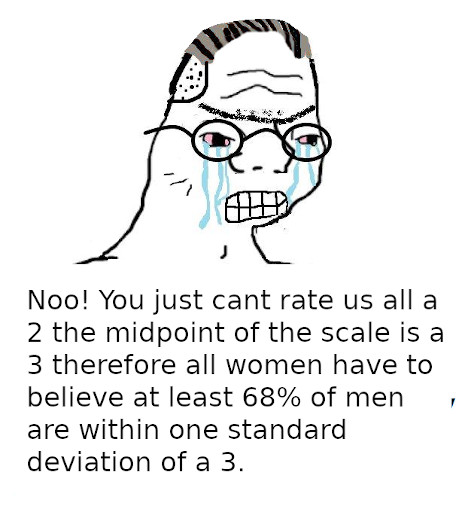
Here is the thing: the sample tells you what the average is, not the scale. If the average male rating on a scale of 5 is a 2, this does not mean that the 2 is “below average.” 2 is the average.
And again, because the sample does not have a perfect normal distribution we should not expect it to fall on the scale midpoint anyway.
How is attractiveness measured
Let’s look at a population trait with a normal distribution: height. Height is easy to measure. We have systems of measurement — centimeters, meters, inches, etc. — that are standard. We arbitrarily invent the measurement, but the distances themselves are an objective part of reality. We also have universal consensus on how well those measurements represent the objective distance.
Physical attractiveness is trickier.
This does not mean that attractiveness is random or subjective, but it does mean that our measurements are not as homogeneous as measurements for height. If a woman rates a man 3 out of 5 stars on OKCupid we don’t actually know if she is saying that she believes the man is a perfectly average man.
We also encounter the philosophical problem of where physical attractiveness exists. Physically attractive could mean how others see or rate you. Alternatively, physical attractiveness could be an objective quality like the distance represented by measurements of height.
In studies using facial measurements the latter may be assumed; objective metrics are used to represent physical attractiveness. In studies on physical attractiveness that require rating a face or picking someone to date, the measure of attractiveness is the ratings or behaviors of other people. Even when there is widespread agreement, the observer, the person doing the rating, is the measuring instrument. There is inherent subjectivity, unlike in the tape measure used to assess height.
Subjectivity does not mean randomness however. It does not mean that we have to pretend that we don’t know that universally attractive traits exist, nor that there is widespread agreement on some traits being attractive. The subjective ratings of people can agree. Indeed, they usually do. We see strong inter-rater correlations across multiple attractiveness metrics, cultures and ages (Bronstad & Russell 2007, Coetzee et al. 2014, Hönekopp 2006, Knight & Keith 2005, Kramer et al. 2018, Ma et al. 2016).
In other words, as an implication of this methodology, women are the true measure of male attractiveness. Men are likewise the true measure of female attractiveness.
The implication is that women and men can’t be “wrong” about their ratings. If women rate most men as a 2 on a 5 star scale, most men are a 2. The distribution simply is what it is.
Women are more attractive than men
Women are rated as more attractive than men (Cross & Cross, 1971; Maret, 1983; McKelvie, 1981; McLellan & McKelvie, 1993; Morse & Gruzen, 1976; Wernick & Manaster, 1980, as cited in McKelvie & Stuart, 1993). This is true both in the Rudder’s dataset and more generally as a trend in research on physical attractiveness.
I have been asked how this is possible — if attractiveness is normally distributed then surely men and women must have the same mean level of attractiveness… right?
Well, no. Let’s return to the height example. Height is normally distributed for men and women, but men are nonetheless taller than women.
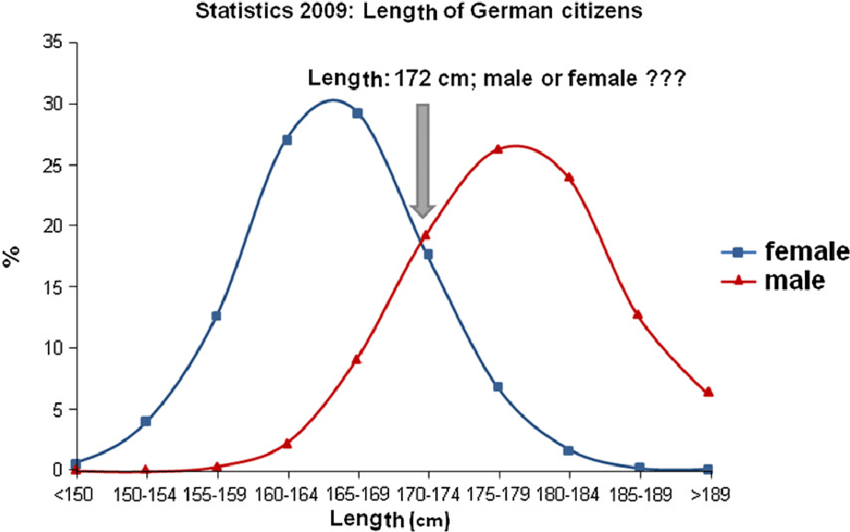
Distributions don’t tell you what the values of the distributions are. Knowing that a distribution is normal does not give you the values associated with that distribution.
The practical implication here is that there is not a 1:1 ratio of “looks-matches” for men and women. If women are more attractive than men, some highly attractive women (at the far right tail) will have no or fewer men who match them in looks. Some highly unattractive men (at the far left tail) will have no or fewer women who match them in looks.
This may explain in part why, although we see assortative mating in physical attractiveness (men and women pick partners of a similar level of physical attractiveness), women are also slightly more attractive on average than their partners (McNulty, 2008).
There may be a good explanation for this as well. Jokela (2009) found that moderately attractive women were more likely to reproduce (7%), while highly attractive women were even more likely to reproduce (16%). Moreover, both were more likely to have daughters than sons. As such, we see a gradual shift over time of women becoming more physically attractive than men.
Conclusion
We can’t just assume prima facie that attractiveness is normally distributed, nor that it shares the same distribution, for men and women. Nor, even if we do assume an identical distribution, can we assume that the distributions have equal values (that men and women are equally attractive). Indeed, we may have more unattractive than attractive men in the population. At the same time, women are more attractive than men on average.
Summary points
- We don’t actually know if physical attractiveness falls on a normal distribution.
- We do see mixed results, with some datasets of male physical attractiveness skewed left.
- Assumptions of normality don’t tell us anything about the values of those distributions.
- As such, we have no reason to assume men and women are equally attractive.
- Research indicates they are not; women are consistently rated as more attractive than men.
References
Bronstad, P. M., & Russell, R. (2007). Beauty is in the ‘we’of the beholder: Greater agreement on facial attractiveness among close relations. Perception, 36(11), 1674-1681.
Coetzee, V., Greeff, J. M., Stephen, I. D., & Perrett, D. I. (2014). Cross-cultural agreement in facial attractiveness preferences: The role of ethnicity and gender. PloS one, 9(7), e99629.
Ferrer, R., & Artigas, A. (2011). Physiologic parameters as biomarkers: what can we learn from physiologic variables and variation?. Critical Care Clinics, 27(2), 229-240.
Hönekopp, J. (2006). Once more: is beauty in the eye of the beholder? Relative contributions of private and shared taste to judgments of facial attractiveness. Journal of Experimental Psychology: Human Perception and Performance, 32(2), 199.
Jokela, M. (2009). Physical attractiveness and reproductive success in humans: evidence from the late 20th century United States. Evolution and Human Behavior, 30(5), 342-350.
Knight, H., & Keith, O. (2005). Ranking facial attractiveness. The European Journal of Orthodontics, 27(4), 340-348.
Kramer, R. S., Mileva, M., & Ritchie, K. L. (2018). Inter-rater agreement in trait judgements from faces. PloS one, 13(8), e0202655.
Ma, F., Xu, F., & Luo, X. (2016). Children’s facial trustworthiness judgments: Agreement and relationship with facial attractiveness. Frontiers in psychology, 7, 499.
McKelvie, S. J. (1993). Stereotyping in perception of attractiveness, age, and gender in schematic faces. Social Behavior and Personality: an international journal, 21(2), 121-128.
McLellan, B., & McKelvie, S. J. (1993). Effects of age and gender on perceived facial attractiveness. Canadian Journal of Behavioural Science/Revue canadienne des sciences du comportement, 25(1), 135.
McNulty, J. K., Neff, L. A., & Karney, B. R. (2008). Beyond initial attraction: physical attractiveness in newlywed marriage. Journal of family psychology, 22(1), 135.
12 comments
isn’t that proves the hypergamy? most of men aren’t attractive on women’s perspective.
” If a woman rates a man 3 out of 5 stars on OKCupid we don’t actually know if she is saying that she believes the man is a perfectly average man”
In 2021 the majority of men were in a relationship with women. If women find the majority of men unattractive and they are ultra picky, why the majority of men are dating?
There does seem to be a discrepancy between reported attractiveness and actual mate selection. Women may be willing to compromise on physical attractiveness. Facial attractiveness may not explain all of the variance in total attractiveness or real world mate selection. Men who look bad in photos might be perfectly acceptable in person. Ultimately, at the end of the day, facial ratings of attractiveness are limited vs real world mate selection.
Despite women rating most men as unattractive, women are selecting most men as partners in actual relationships. If we consider hypergamous selection for physical attractiveness, this would show the opposite – women selecting down, rather than up. In actuality what we see in respect to physical attractiveness is strong assortative mating. Men and women end up with mates very similar in levels of physical attractiveness. Where we tend to see hypergamous selection is in income and education.
If women are more attractive than men on average, how does that translate into men and women ending up with mates who are similar to each other in attractiveness? Doesn’t that just mean that, for example, that the most attractive men will end up mated to the most attractive women, even if the women in those pairings are more attractive than those men on average?
Hi Alex I was just wondering what other reaseach in facial attractiveness gave a normal distribution and can you please let me know
Thanks Alex
Hi Alex I was just wondering what other reaseach in facial attractiveness gave a normal distribution and can you please let me know
Thanks Alex
Great article! I found it interesting how you explained that we cannot assume that physical attractiveness is normally distributed and that assuming an identical distribution for men and women is not a reliable assumption. My question is, what are some other factors that may affect the distribution of physical attractiveness ratings, and how do researchers take these factors into account when studying physical attractiveness?
So women in general find the majority of men unattractive. Nothing worthy of getting emotional for, right? No matter how you pack it, that means most women are forced to settle for someone they don’t see as their equal (like in the musical chairs game). No, that is not due to backfire sooner or later, RIGHT?
This article uses logic to come to false conclusions. There is no mention of race, clothes the subjects were wearing, appearance of socioeconomic status, sexual orientation etc. For reproduction dicks and semen are always on sale and vaginas and eggs are a scarce limited resource. Just because women are choosier and value men less does not mean they are less attractive physically even if they are choosier. In fact men should be more attractive physically than women because women are more selective and only the most attractive men reproduce while the least attractive women reproduce. (just kidding on the last point thats as dumb as the shit this article is saying) Since dating/attractiveness is at the end of the day about sex and reproduction the most attractive person would be someone who 100% will have healthy children that will also have healthy children. Probably being in the top 20% of either gender is maximum fitness. As far as maximum unattractiveness any woman post menopause or infertile man (about 10% of the population) would be considered the most unattractive, so many more women than men.
So what about makeup and plastic surgery, also liposuction… i mean yeah in these times where theres filters the “perception of beauty” from men towards women for sure can be more optimistic because they have tools to “appear”more beautiful even if they really arent that beautiful..
Let’s say women of a single country are indeed getting more attractive over time, to the point where reproductive rates drop and it falls into demographic oblivion. That nation is then replaced with “less attractive” women willing to reproduce.
This is not a stable conclusion based on evolutionary dynamics.
Instead, women are maintaining just enough “disappointment” in men to maintain a sustainable population. Explains quite a few things actually…