Enjoy DatePsychology? Consider subscribing at Patreon to support the project.
The 1:1 ratio
A statistical concept you will need to understand for the following research: in a closed system of heterosexual relationships we expect men and women to report the same number of partners. Every reported pairing by a man needs a report by a woman. If a man says he had sex with ten people, we need ten sexual partners accounted for on the female side. For example, one woman with ten partners, ten women with one partner, or two women with five partners.
Yet, we consistently don’t see this. On average, men report having more partners. We are looking for a ratio of 1:1. We don’t find it.
If the word average immediately caught your attention then you are on the right track. When we look at the data on sexual partner count, men and women have very similar distributions and numbers of sexual partners despite having different means.
Social desirability bias
Social desirability bias is the tendency to self report in a socially desirable way on surveys or questionnaires. For example, women may report fewer sexual partners because promiscuity has a greater social stigma for women. When I began researching this topic I expected I would need to address social desirability bias a great deal.
It turned out that social desirability bias was less relevant than I expected. Most men and women were already reporting very similar numbers of sexual partners. The large average difference between men and women was not bimodal. The distribution does not look like this:
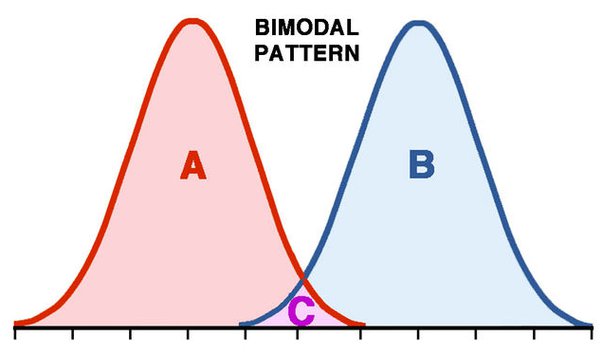
The research included will nonetheless address social desirability bias. The reason I say social desirability bias was less relevant than I expected is because we don’t see a biased distribution like the one above. Instead, we see a large degree of male-female agreement for most survey respondents.
The Morris Study
A consistent observation across the literature is that men report having more sexual partners on average than women do. Nnko (2002) described this as “swaggering males, secretive females.” This is a problem in sexual behavior research. We should expect a 1:1 ratio for heterosexual pairing. So is everyone really lying?
What the data show is that, at least, not everyone is lying. An average is just an average. It is not a complete picture. Averages neither tell us magnitude (to what degree men and women report differently) nor distribution (which men and women report differently). This is where we find our inaccurate reporters.
In a demonstration of how statistical tail effects (outliers) skew averages, Morris (1993) analyzed GSS data for lifetime and yearly sexual partners. 90% of male and female respondents — all respondents who reported having fewer than 20 lifetime partners — reported having within one sexual partner of each other. The ratio was 1 to 1.3. By excluding outliers, male to female report discrepancy was reduced from 600% to 20%.
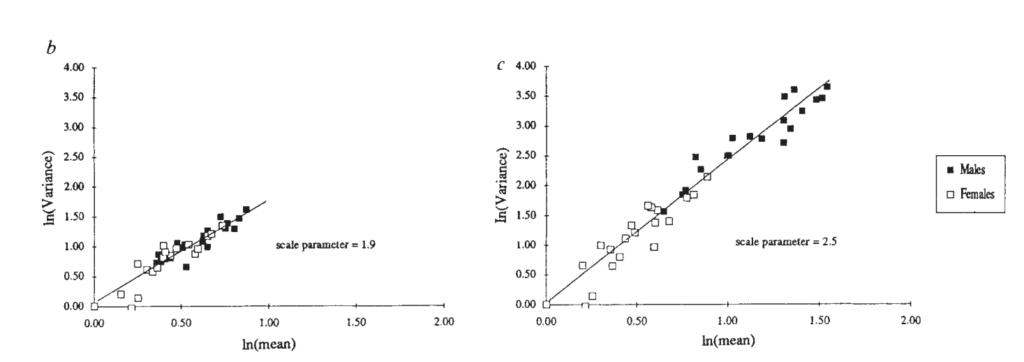
Further, this was a ratio consistently found year-to-year in the GSS data. It is only when self-reporting high levels of partners that a large difference emerged. See Figure 1 from the Morris paper. Men, but not women, report high levels of partners in the double digits. A minority of men reporting high numbers creates a long right tail that skews the average for men.
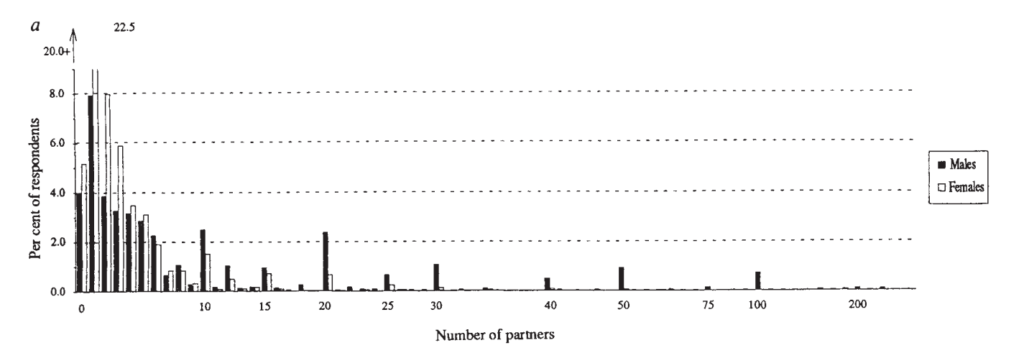
Figure 2 is the male and female variance for self-reporting of lifetime partners. On the left, men and women who report fewer than 20 lifetime partners. On the right, the whole sample. As soon as you remove the ~10% of men and women who report over 20 lifetime partners the variance approaches zero. Most men and women do not report different numbers of partners.
This was in 1993, but you can also see from the recent GSS data on how many sexual partners people had in 2021 that the pattern has remained. In fact this pattern has been consistent across sexual report surveys over the years. We see long right tails in the distributions for lifetime partners.
The Wiederman Study
Wiederman (1997) tested a number of alternate explanations for the male to female report discrepancy. One explanation was that men and women interpret “sexual partners” differently. However, upon examination men and women did not report report a greater degree of non-inclusion of casual sexual partners. Removing those individuals did not decrease the report discrepancy.
Self-rated honesty did not predict the discrepancy and removing individuals who reported lower honesty did not reduce the discrepancy.
Accounting for prostitution or sex work only slightly lowered the report ratio. A small part of the difference could be accounted for by men who visit sex workers and women who are sex workers. As a very small population, female sex workers may be under reported even in large sample data (Brewer et al. 2000). However, as this was only a small part it does not explain the ratio.
What really reduced the ratio was self-report accuracy. By removing people who reported a low level of accuracy in reporting their past number of sexual partners, the discrepancy disappeared. The remaining men and women reported sexual partners at the same rate. Here we are close to our 1:1 ratio.
Further, twice as many men as women reported a low level of accuracy and a high number of partners. Removing those men from the dataset eliminated the gender discrepancy, indicating a gendered direction of the relationship: men with poor recall, rather than women, accounted for the gender discrepancy.
Wiederman’s research also validated the Morris (1993) data. Low recall participants were mostly men reporting high numbers of partners. By removing men who admitted having poor recall Wiederman also removed the right tail of the distribution that skewed the mean partner count for men.
In a replication within the same paper, Wiederman examined GSS sexual behavior reports. A pattern emerged for the preference of round numbers such as “10.” At greater than 15 partners, 82% of respondents gave a figure that ended in a 0 or a 5. Every number over 36 that was reported in the entire dataset ended in a 0 (“50,” “60,” “70,” etc.).
The pattern for selecting round numbers shows inaccurate reporting. We don’t have sex with people in multiples of five or ten. The pattern shows guessing, rounding or inventing whole numbers in the subset of people who report high partner counts. Instead of “I know I have had sex with exactly thirty-six people in my lifetime” think more “yeah maybe I had sex with 40 or so people.”
Revisit Figure 1 from the Morris paper. Again we see the same rounding effect and preference for multiples found in Wiederman (1997). Virtually all of the men with 20+ partners reported 25, 30, 40, 50 or 100.
The discrepancy also increased linearly with age (table below). As people got older, and/or accumulated more partners, their reporting accuracy decreased.
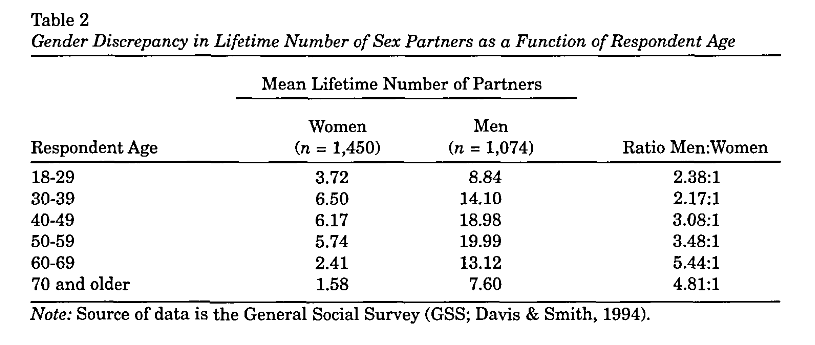
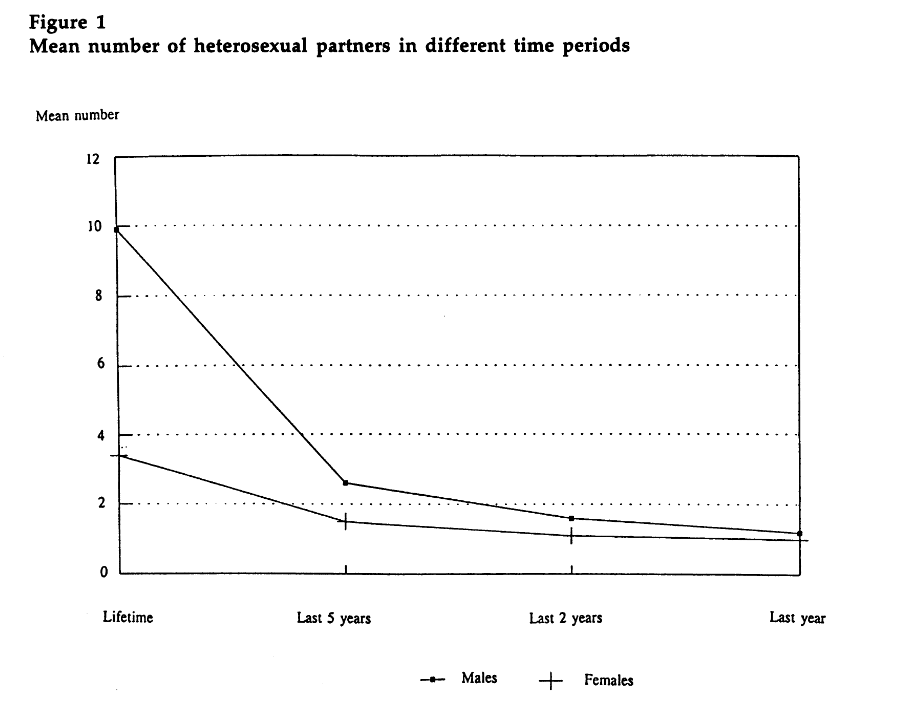
The above mentioned studies also confirmed previous research by Wadsworth et al (1993), which found that male-to-female report ratios decreased with the time between the sexual act and reporting. In a large nationally representative survey, lifetime partner count for men was 9.9, while for women it was 3.4. This dropped to 2.6 and 1.5 for men and women respectively over the last five years. In the last two years it dropped to 1.6 and 1.1 for men and women, while reporting over the last year decreased further to a ratio of 1.2 to 1 for men and women. Again we approach the 1:1 ratio that indicates accurate reporting. See the table below:
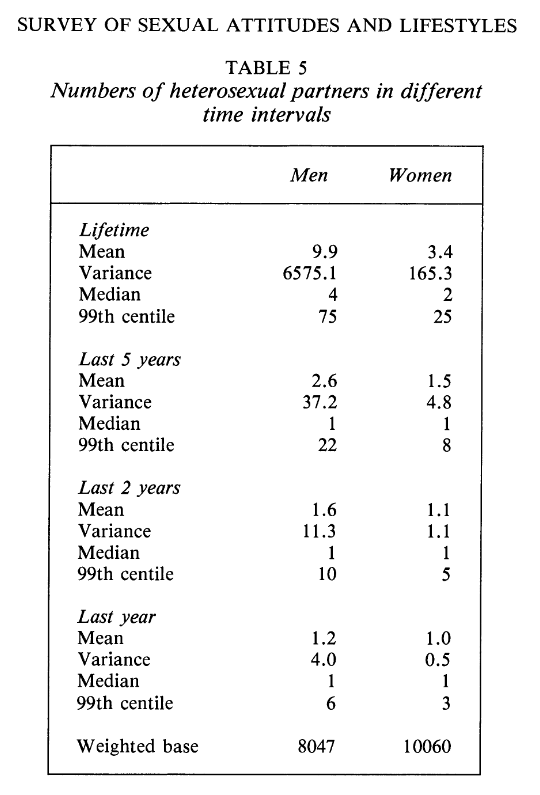
Dare & Cleland (1994) reproduced this table as such:
The finding that men and women report close ratios of sexual partners in more recent 1-5 year periods has been consistently replicated on yearly basis since these studies in the early 1990s (Brewer et al., 2000; Wadsworth et al, 1996).
When interpreting average overall self-reports of partner count, the implication here is that more recent periods are more trustworthy than less recent periods. People may recall their exact number of partners more accurately. Having naturally fewer partners within a one-year period may also generate less motive to “swagger” and exaggerate partner counts. Even up to five years, the ratio remains fairly close. It is only when we examine lifetime partners that we see a big divergence between how men and women report.
Brown & Sinclair
Here again we see a tail end male preference for large, round numbers in a paper by Brown and Sinclair (1999):
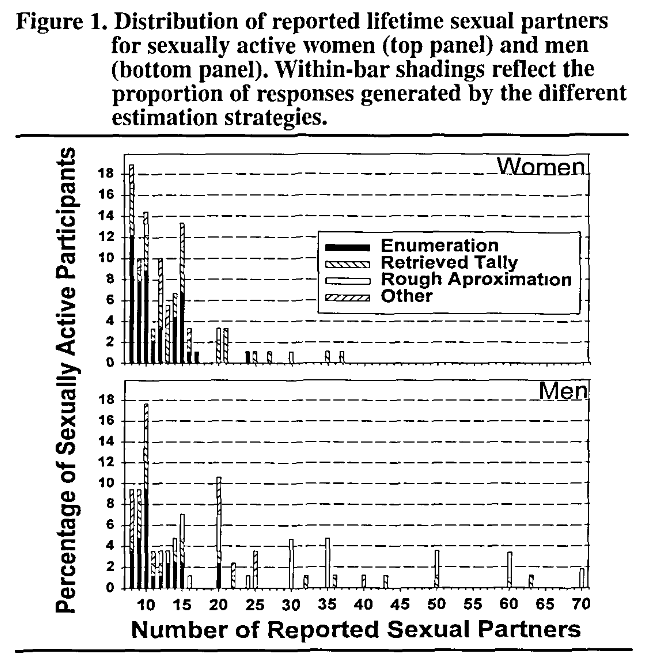
This chart begins at eight partners. Brown and Sinclair began this chart at the tail of the distribution, where report ratios begin to vary, “because men and women who have had relatively few partners provide similar estimates and use similar response strategies.” Only 10% of the total sample reported eight or more lifetime partners.
The bars are marked to show the estimation strategy used. Coinciding with the large, round numbers are “Rough Approximation” and “Retrieved Tally.” 29.4% of male responses were rough estimates while only 4.4% of female responses were rough estimates. Women were more likely to report an enumeration strategy, or to be able to specifically account for every person they slept with (48.9% women, 29.4% men).
Additionally, there was not a statistically significant difference between men and women who used the same estimation strategy. When looking at only the past year of sexual history, men and women also did not report statistically significant numbers of partners.
Brown and Sinclair referenced a series of papers that this finding replicated: ACSF Investigators, 1992; Johnson et al., 1992; Laumann et al., 1994; Morris, 1993; Smith, 1992. This finding has also been replicated more recently in Kirstin et al., 2019 and Bogart et al. 2007.
The Turchik & Garske Study
The desire for social desirability is an expression of personality. As an expression of personality, the need for social desirability varies from person to person. Some people may have a high need for social desirability. Others may care less. We can measure the need for social desirability — so what if we just screened for social desirability and removed people who scored highly?
Turchik & Garske (2009) used the Marlowe-Crowne Social Desirability Scale (MCSD;
Crowne & Marlowe, 1960) and the Sexual Self-Disclosure Scale (SSDS; Catania, McDermott,
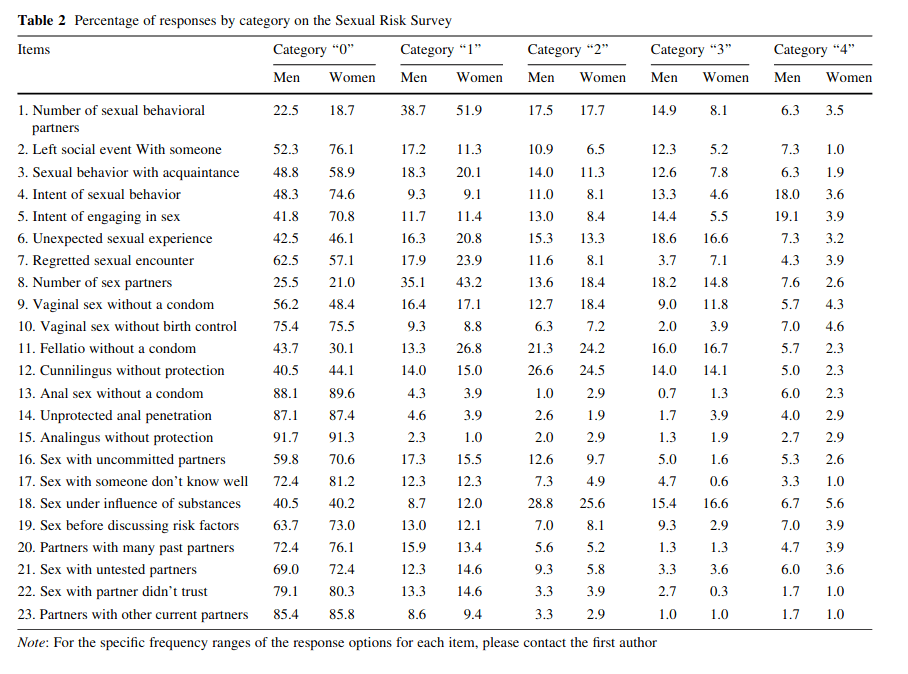
& Pollack, 1986). These are psychometric tests with high test-retest reliability (they replicate results), inter-item validity (they are internally consistent) and construct validity (they predict real-world outcomes consistent with what they are designed to test). Additionally, Turchik & Garske measured a number of specific sexual behaviors as well as sexual partner count.
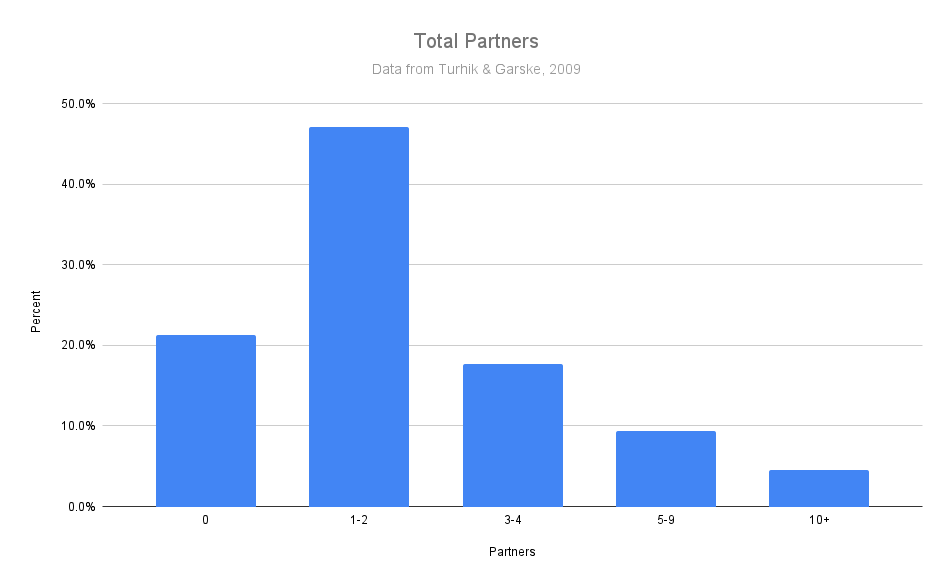
First, the distribution of sexual partners mirrors what was found in the previous two studies, as well as the GSS 2021 data that I ran. 21.3% of total responses reported zero sexual partners, 47.1% reported 1-2 sexual partners, 17.7% reported 3-4 partners, 9.4% reported 5-9 and the remaining 4.5% reported greater than 10 partners.
This is the distribution we consistently see replicated across all sexual behavior research: most people cluster with few partners on the left tail.
Neither the Social Desirability Scale (a measurement of social desirability bias) nor the Sexual Self-Disclosure Scale (fear of having your sexual behavior disclosed) predicted reports of risky sexual behavior. The SSDS weakly predicted (-.13) impulsive sexual behavior.
This research does not support the claim that people (women) under report sexual behavior — not even even risky and taboo sexual behavior — out of social desirability or a fear of having their sexual behavior disclosed.
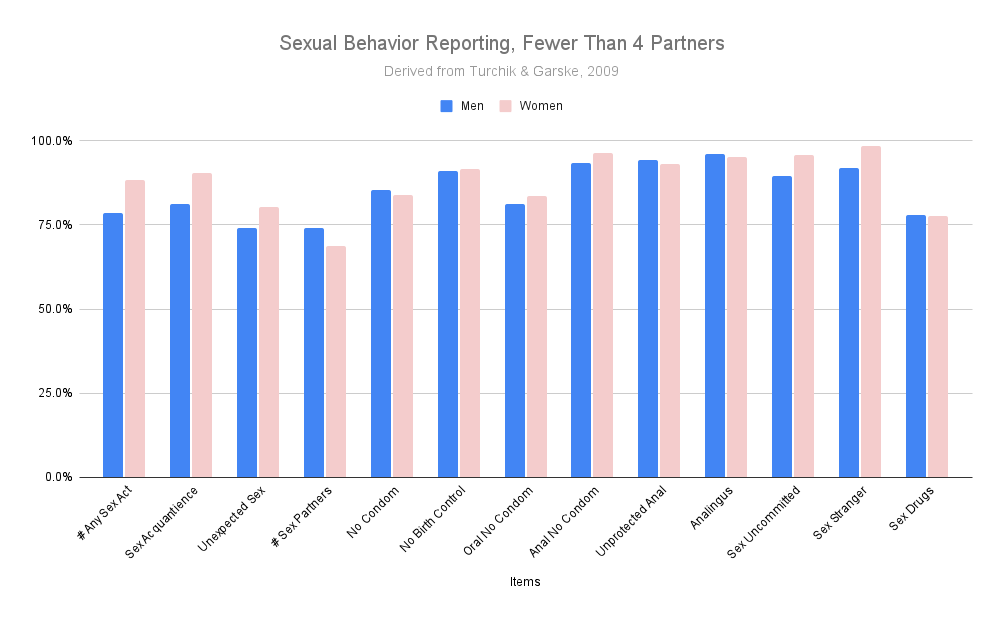
Across multiple items men and women reported risky and taboo sexual behaviors at nearly identical rates. Below is my chart of the Turchik & Garske data from Table 2:
Here are the same rates except only for the men or women who reported 10+ partners:
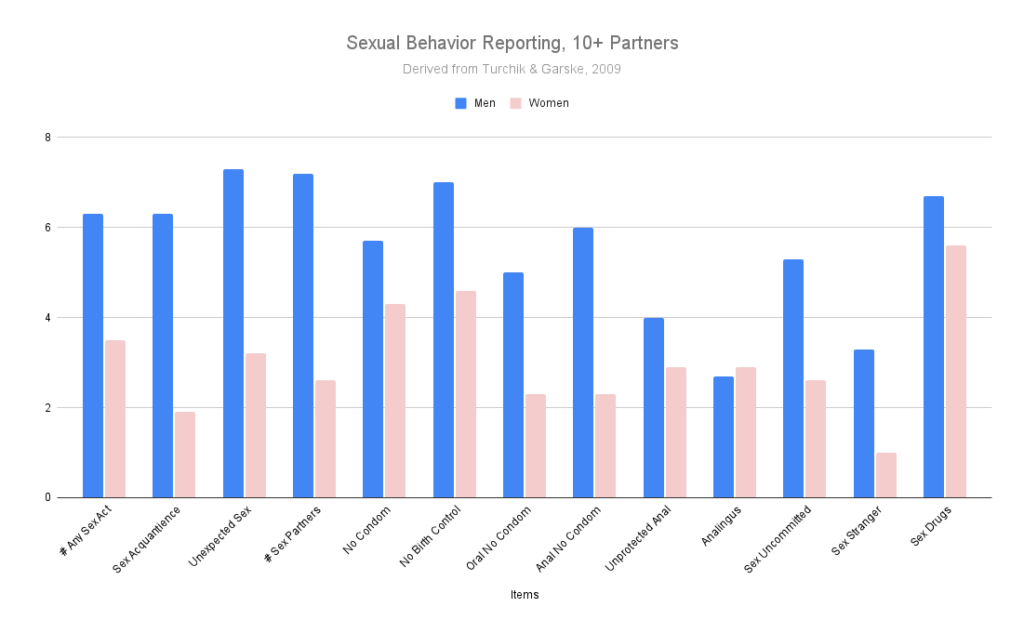
Again we see the pattern that we saw in the previous papers. Men and women who report low partner counts report very similar ratios of sexual behavior. It is only when we see high partner reporting that we begin to see a difference between men and women. As fewer than 5% of men and women fall into this category (in this sample), we should expect generally accurate self-reporting of sexual behavior from most people.
This was a large sample of undergraduate students with a mean age of 19. The previous studies were large nationally representative samples. That we see a similar male-to-female self report ratio in a young college sample may again show that young Westerners do not fear honestly disclosing sexual behavior in anonymous research surveys. This is also an example of when nonrepresentative convenience samples align well with representative samples.
It has been posited as an explanation that men and women don’t “count” sexual acts the same. For example, a man may count oral sex as one partner while a woman may not. The Turchik & Garske data do not show this. As you can see from the first Turchik & Garske chart, men and women report specific sexual acts at very similar rates. The Sexual Risk Survey (SRS) asks highly specific questions about sexual behavior. You can read the SRS questions in the Appendix at the bottom of this page.
The Brewer et al. Study
As noted from Weiderman (1997) previously, prostitution did not account for much variance in the lifetime reporting of partners. However, this study did not examine the shorter durations (1 year to 5 years) where a much smaller male-to-female report ratio discrepancy remains.
The GSS is nationally representative data with very large sample sizes. However, even large representative samples can miss or underestimate the effects of small population outliers. We have seen up to this point how the “swagger” of outliers in the form of male overreporting skews lifetime sexual partner averages. But is it really just swagger?
Brewer et al. (2000) examined if female prostitution could account for the small discrepancy that still remains in sexual history reporting during shorter time frames of five years and one year. An estimate of 4% of women engaging in prostitution was sourced from survey, police arrest and prostitution-related disease reporting. Although the GSS measures prostitution and sexual reporting by prostitutes, it only reported 1 versus and expected 1.6 prostitutes, indicating a sampling bias that underreported female prostitution.
When the sampling bias was corrected, the sexual partner count ratios of men and women came very close to 1:
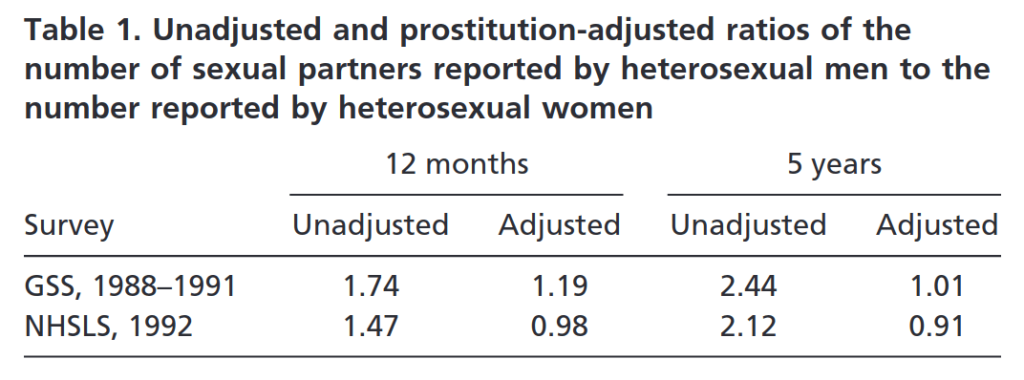
This research gives us an alternate interpretation for at least some of the discrepancy in male-to-female reports at high partner counts: undersampling of sex workers with extremely high partner counts. It isn’t enough to explain the entire discrepancy, but it does help close the male-to-female report gap further.
The Alexander & Fisher Study
“People lie” is a common (albeit weak) objection to survey results. But if “people lie” can we detect it? Unfortunately, “lie detector” or polygraph machines are unreliable pseudoscience. Nonetheless, polygraphs are useful precisely because most people don’t know that they are unreliable pseudoscience. When strapped to a polygraph people report and behave as if their lies will be discovered, which lets us use a methodology called the bogus pipeline. If people are dishonest we may detect it by a change in response under the bogus pipeline condition. If people are not dishonest, however, we will see no difference between the bogus pipeline and a control.
Alexander and Fisher (2003) examined responses in three conditions: a face-to-face interview or “exposure threat” condition, an anonymous condition and a bogus pipeline. The Marlowe-Crowne Social Desirability Scale and scales measuring sexual behavior were also used.
As expected, social desirability scores using the Marlowe-Crowne Social Desirability Scale were highest in the exposure threat condition, medium in the anonymous condition and lowest in the bogus pipeline condition.
Yet in reporting sexual partner count there was no statistically significant difference between men and women. The mean partner difference for men and women in the anonymous condition was 4.2 and 3.4, while in the bogus pipeline it was 4 and 4.4. If an effect existed, it was small and not detected beyond chance. This is what we should expect if people are mostly honest outside of the bogus pipeline. In other words, if people are honest on normal anonymous survey responses. By strapping people to a polygraph we don’t see that they change their responses. This is what we should expect if the previous responses were truthful.
The same author (Fisher, 2013) repeated this research and found a statistically significant, but small, effect of the bogus pipeline: the average difference between partner count for both men and women in the bogus pipeline to non-pipeline condition was less than one partner.
Conclusion
We have seen a consistent trend in the research: men report more lifetime sexual partners than women do. The key word here is lifetime, since as soon as we look at shorter periods of time, between one to five years, most of the discrepancy disappears. Additionally, the lifetime discrepancy is not equally distributed and does not apply to most people who respond. Most men and women are reporting the same number of partners, both for recent time periods and over the lifetime.
We have a good idea why this is the case: men on the right tail of the distribution — the high reporters — are using inaccurate reporting strategies and overreporting their lifetime number of sexual partners. The overrepresentation of large, round numbers is evidence of an inaccurate estimation report strategy. When we remove men who admit they do not have perfect recall, as well as when we remove men who use an estimation strategy for reporting, the discrepancy between men and women disappears.
This does not mean there is not a “swagger” and “secretive” effect at all. It’s likely the case that men still overreport and women still underreport. In the bogus pipeline research, this effect was found — but it was very small, less than one partner on average.
Point Summary:
- This subset has been shown to round their reported number of sexual partners up.
- When these over-reporters are removed, male-to-female reporting approaches a 1:1 ratio.
- When men who report low recall accuracy are removed, the male-to-female report ratio approaches 1:1.
- Bias is higher for older, rather than younger, respondents.
- Male to female report ratios approach 1:1 over shorter time frames.
- When accounting for female prostitution at short time frames, male to female report ratios approach 1:1.
- Measures of social desirability and fear of disclosure do not consistently predict under reporting of taboo sexual behaviors.
- We do not see a consistent difference in reporting risky or taboo sexual behaviors between men and women.
- We consistently see a similar reporting distribution across datasets.
- We don’t see a large response difference under bogus pipeline methodology, indicating truthful response.
- Large representative samples generally leverage best practices, such as anonymity, for reducing response bias.
References
Alexander, M. G., & Fisher, T. D. (2003). Truth and consequences: Using the bogus pipeline to examine sex differences in self‐reported sexuality. Journal of sex research, 40(1), 27-35.
Bogart, L. M., Walt, L. C., Pavlovic, J. D., Ober, A. J., Brown, N., & Kalichman, S. C. (2007). Cognitive strategies affecting recall of sexual behavior among high-risk men and women. Health Psychology, 26(6), 787.
Brewer, D. D., Potterat, J. J., Garrett, S. B., Muth, S. Q., Roberts, J. M., Kasprzyk, D., … & Darrow, W. W. (2000). Prostitution and the sex discrepancy in reported number of sexual partners. Proceedings of the National Academy of Sciences, 97(22), 12385-12388.
Brown, N. R., & Sinclair, R. C. (1999). Estimating number of lifetime sexual partners: Men and women do it differently. Journal of Sex Research, 36(3), 292-297.
Dare, O. O., & Cleland, J. G. (1994). Reliability and validity of survey data on sexual behaviour. Health Transition Review, 93-110.
Morris, M. (1993). Telling tails explain the discrepancy in sexual partner reports. Nature, 365(6445), 437-440.
Turchik, J. A., & Garske, J. P. (2009). Measurement of sexual risk taking among college students. Archives of sexual behavior, 38(6), 936-948.
Wadsworth, J., Field, J., Johnson, A. M., Bradshaw, S., & Wellings, K. (1993). Methodology of the national survey of sexual attitudes and lifestyles. Journal of the Royal Statistical Society: Series A (Statistics in Society), 156(3), 407-421.
Wadsworth, J., Johnson, A. M., Wellings, K., & Field, J. (1996). What’s in a mean?—An examination of the inconsistency between men and women in reporting sexual partnerships. Journal of the Royal Statistical Society: Series A (Statistics in Society), 159(1), 111-123.
Wiederman, M. W. (1997). The truth must be in here somewhere: Examining the gender discrepancy in self‐reported lifetime number of sex partners. Journal of Sex Research, 34(4), 375-386.
7 comments
Interesting. Thanks.
I do have a question. I have known men who, when in their late teens and early 20’s bedded hundreds of distinct young women (I did not, but I have known at least 3 who did) each. While having lost track of one of them the other two both settled down to one partner by their mid-20’s. This means that in their case the long tails would not be unrealistic and a rounded number would be appropriate (one fellow recalled basically sleeping with a different woman every night for about 3 years – it was the late 70’s…) since recalling exact numbers in that kind of a lifestyle would be impossible.
Perhaps an avenue for future research?
Again, a very small number of men of the thousands I’ve known over the years.
If I have understood your research correctly they would be accounted for by each of the women adding them as a ‘1’ so that in the end the 1:1 correspondence of the statistical distributions would be the same. Is this a correct assumption or do you simply limit the end of the curve to remove the outliers?
Respectfully Yours,
David
It’s interesting to see an analysis of this discrepancy – not the cause that I would initially have expected. As someone who reached the 3-digits last month in partner count, I would have guessed that people with higher partner counts would tend to underreport from forgetting individuals, not overreport from estimation. When I think back about certain periods of my life, I tend to remember them as less promiscuous than they actually were, and forget about a lot of interactions.
You talk about the social desirability bias relating to partner counts, but in my experience having a high partner count as a man is often seen as sleazy rather than cool. I’m honestly a little embarrassed to know my partner count given how high it is. There are a lot of people who frown on that sort of thing and some people will be quick to label you as arrogant/braggadocios even if they just infer that you have a lot of partners. I personally find men who think that sleeping with a bunch of women is an accomplishment cringey.
Anyway, your content is really interesting to me. We all live our own, individual curated lives and it’s easy to forget just how much that can different from the average person’s experience.
I don’t believe one should just remove the male tail end and call it a day. It isn’t surprising that males with exceptionally, some even ridiculously high partner counts, will not track the numbers exactly. Furthermore, from my own experience as well as those who I personally know, most of hookups happen during a quite limited “phase” in ones life. Beyond that, the yearly partner counts will drop severely. Past that point, their answers for the last 2-1 years would reflect the population average, in stark contrast to their lifetime totals.
For neither reason should one assume their responses to be false and remove them from the dataset.
In fact, according to the male variability hypothesis, it is probably the outliers that one should study *the most*, instead of ignoring. Eg we know of rock stars whose bodycounts ranged in the thousands. We know of kings fathering sons in the hundreds – at the extreme standing Genghis Khan, assumed as the cause of the major genetic anomaly in Asia, with over a thousand children and modern descendants numbering 0.5% of entire humanity. One can only imagine what the bodycount may have been. How accurately would he have estimated his sexual partners?
By removing the outliers, one will get a very limited and skewed – and most importantly, false – understanding of the full picture.
So you are talking here mostly about the reporting ratio of men to women. What about reporting errors in general? What happens if people generally over report their sexual activity, out of shame, wouldnt that mean that sexlessness is higher than reported?
I don’t understand one thing the bogus pipeline example changed woman average from 3.4 to 4.4 even suprassing man average, how can this be said of low relevance when it change the data so much? like the first question of social stigma affecting the self report seems to be validated with this, the idea of if you lie you’ll be caught made a 29% increase.
It is low relevance because the change from 3.4 to 4.4 was not statistically significant and the effect size was quite small. The study itself states this, as cited here:
https://datepsychology.com/did-a-fake-polygraph-catch-women-lying-about-their-sexual-partner-count/
Reading the original study, the authors have stated this as well, which is why it is of low relevance and debunks the idea that women underreport their sexual partner count