Enjoy DatePsychology? Consider subscribing at Patreon to support the project.
In statistics, one of the very first things people learn is that you need a good sample. First, literally. The importance of selecting a good sample, which is usually reduced to sample size and representativeness, is a Day 1 topic in most statistics classes. Statistics is a science of inference from samples to populations, so naturally sampling is the starting point.
Unfortunately, this is where most people also stop learning statistics. Beyond a mandatory course or two, most people don’t go on to any applied use of statistics. They don’t go on to conduct samples and perform research, so they are never confronted with the reality of sampling. This leaves them with an idealized mental image of what sampling in real research looks like. People seem to think that researchers are really out there getting large, representative datasets of the population. It would be nice, we can dream, but they are not.
A meta-analysis of sampling methodology found that approximately 87% of published papers used student convenience samples (Peterson, 2001). A more recent paper put the estimate at 95% (Jager et al., 2017). What is a student convenience sample? This is when you just pluck students out of the university you work at for a sample. This raises questions about external validity and representativeness, or how well you can generalize from your sample to the general population. If your sample is unlike the population you wish to generalize to, or more accurately if your sample is not drawn from the population, you may not be able to make inferences about the population from your sample.
But this does not mean your sample will produce different results, as we will see below.
More recently, researchers have begun to use online sampling platforms such as Prolific and MTurk. These are also convenience samples. You have a ready-and-waiting group of participants for your study who get paid to take it. In essence, people sitting around at home taking surveys for cash. Is this representative of the general population? It is not. These are not inherently “better” or “more representative” than throwing a poll up on a large social media platform. In fact, some research has found that you get a better sample from Facebook than these paid platforms (Antoun et al., 2016).
In neuroscience, samples are usually unrepresentative and small. The top 1000 most-cited papers in neuroscience have an average sample size of 12, while the average across the field is about 24 participants (Szucs & Ioannidis, 2020). Representative samples are even less common, given that in neuroscience your experiments often require someone to come into the lab (for neuroimaging, or for behavioral tasks). Again, it’s mostly students who participate. If not students, it might be a clinical population, such as the elderly (again, unrepresentative).
In medicine, similarly, most samples are convenience samples (Cleophas et al., 2012). It’s rare that a clinical trial is performed on a representative sample of the population. Samples are drawn from populations in hospitals.
When convenience samples work
The reality of sampling is that the best sample is the one you’ve got. Fortunately, minds, brains, and bodies are similar enough that most psychologists (or neuroscientists, or doctors) believe you can learn something about individuals from convenience samples. If not a formal belief, it is a belief in practice. It’s not the gold standard, but it’s “good enough.” This is why convenience sampling has not been scrapped entirely.
Plus, it works. At least, it works a lot of the time. How do you know? Well, you can see how well your own sample generalizes to another convenience sample, or to more representative results.
Let’s use an example from political psychology. This is a domain where generalization to the broad population is very important. Why? Because, to some extent, everyone participates in politics. You also want to predict national outcomes and you want to predict them with a small margin of error. This overlaps with the field of demography, or the study of human populations, a field that places a great deal of emphasis on national representativeness.
Mullinix et al. (2015) contrasted the results of four different convenience samples with a nationally representative sample across political measures. They asked questions about immigration, the DREAM Act, free speech in “hate rallies,” and student loans. Here is a chart of how well convenience samples matched a nationally representative sample (TESS):
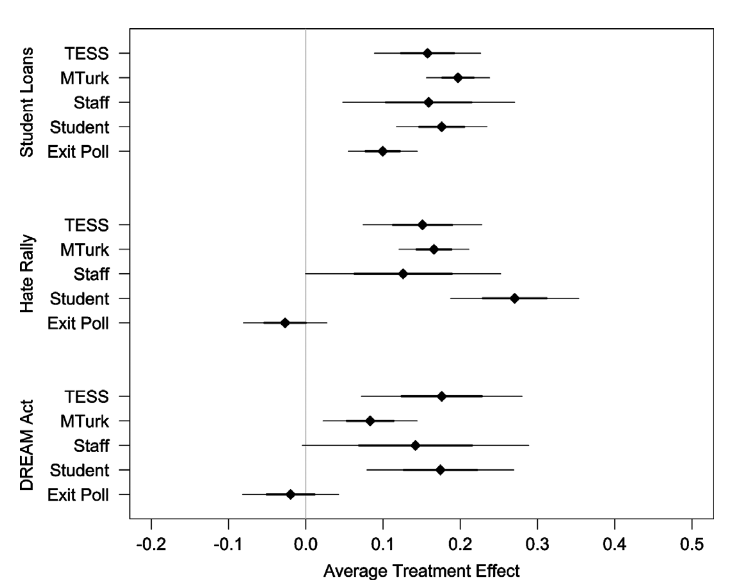
Time-sharing Experiments for the Social Sciences (TESS), the nationally representative sample, matched online, student, and staff convenience samples quite well. In fact, none of the results were significantly different. Per Mullinix et al. (2015): “each of the convenience samples yields an estimated treatment effect in the same direction as the TESS sample estimate, that is statistically distinguishable from zero, and that is also statistically indistinguishable from the TESS sample estimate.”
As a side note, the TESS sample used in this paper cost $15,000 to administer. That’s the price of conducting a good nationally representative survey — and a major reason most research doesn’t use them.
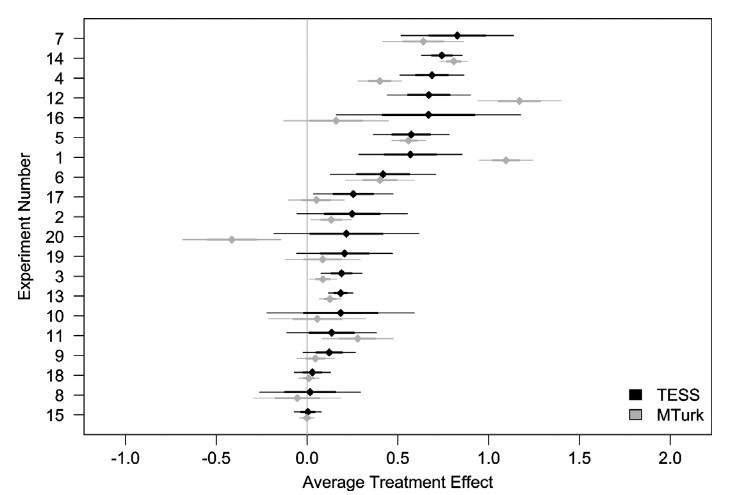
These are not the only items in Mullinix et al. (2015). This effect was replicated across 20 separate experiments. Here are the results of an online survey contrasted with the nationally representative TESS sample:
This is not the only paper that has done this. Vitriol et al. (2019) compared ten representative datasets with unrepresentative subsamples measuring political and personality variables. As with Mullinix et al. (2015), there were no major differences.
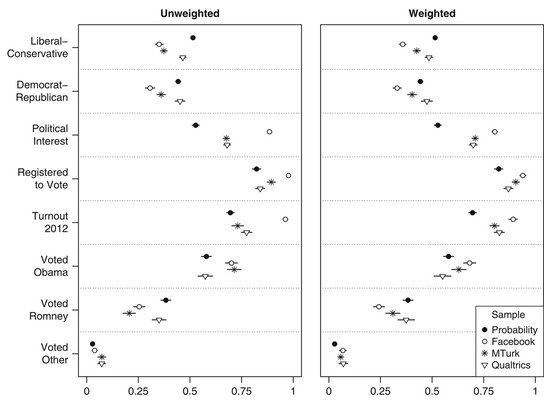
Here is a similar comparison of convenience samples, including surveys on Facebook, with nationally representative polls from Boas et al. (2020). The chart two shows replications of treatment effects on political ideology across representative and unrepresentative samples.
Turns out convenience sampling works pretty well! At least for the specific questions asked across these experiments. This may not be the case for other experiments. This is important, because understanding if the convenience sample you select will be appropriate to use might mean knowing if you are in a subfield of psychology where convenience samples tend to match representative samples (or other non representative samples). I research dating, relationships, and attraction: do these subdomains play nice with convenience samples?
I ran a large survey on Twitter using the Chicago Face Database (CFD) and asked people to rate faces. The CFD is a database of faces that have been pre-rated for attractiveness by an independent sample. How closely did the ratings of Twitter users match?
Remarkably well:
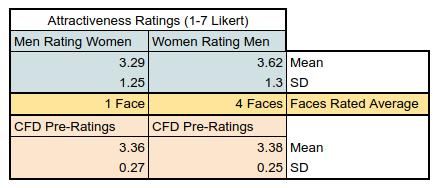
The CFD pre-ratings and the ratings of Twitter users were almost exactly the same. The difference was not statistically significant. This is quite surprising, given the size of my sample (N = 1,812). A large sample means more statistical power, or the ability to detect an effect. Even a small difference should produce statistical significance with a large sample. Yet it didn’t, because the ratings were that similar.
Estimating demography versus measuring universal cognitive processes
A debate within psychology and neuroscience is the extent to which representative samples are necessary to measure so-called universal cognitive processes. If our minds work the same way then we may not need much representativeness to make an inference. Conversely, if our minds are very different, we may not be able to generalize very well. Attractiveness is one domain where, across the literature, we see fairly high agreement. Regardless of the sample, regardless of the culture or the population, people tend to agree pretty well on what an attractive face is (Langlois et al., 2000).
That’s good news if you’re a psychologist researching anything related to faces.
This is related to the difference between external validity and theoretical relevance. If you want to estimate how many of X reside within a population, you need a representative sample of the population. If you want to know if there is a relationship between X and Y, this may not be necessary. Coppock & McClellan (2019) write: “for descriptive work, we need probability samples, but for research that models the relationships between variables, convenience samples may be acceptable … MTurk and probability samples are descriptively quite different, but the correlations among survey responses are similar … even extremely idiosyncratic convenience samples (e.g. Xbox users; Gelman et al., 2016) can sometimes produce estimates that turn out to have been accurate.”
In 2014, the AAPOR (Baker et al.) issued a series of guidelines for when convenience samples are appropriate and when representative samples are needed. To sum it up, the only clear takeaway is that you probably shouldn’t use convenience samples for estimating frequencies within a population. When you have a theoretical basis to test the relationship between two variables then a convenience sample can work very well.
Or, from Survey Sampling by statistician Kish (1965):
“Great advances of the most successful sciences—astronomy, physics, chemistry—were, and are, achieved without probability sampling … no clear rule exists for deciding exactly when probability sampling is necessary, and what price should be paid for it … probability sampling for randomization is not a dogma, but a strategy, especially for large numbers.”
What else is an example of a cognitive process you might believe to work consistently across populations? Well, perhaps the relationship between autism and theory of mind. Theory of mind deficits have been called the core feature of autism. When I ran a theory of mind test on a convenience sample of incels, who report high rates of autism, what did I find? That low scores on the Reading the Mind in the Eyes Test predicted incel identification. This is also an example of a population where we will probably never see a truly representative sample used, because we don’t know the full scope of the population nor do we have access to it.
There is a researcher on Twitter named Aella (@Aella_Girl) who has a large platform and uses it to conduct huge surveys on relationships and sexual behavior. Here are results she found for an infidelity item:
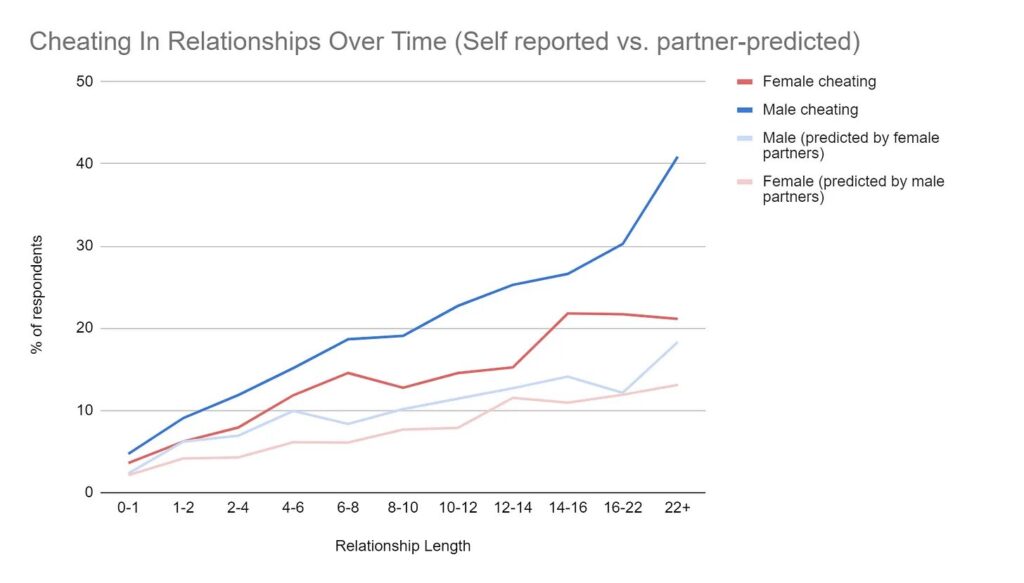
This is highly consistent with the literature we have on infidelity: men cheat more, about twice as much as women. Is the frequency high/low? Perhaps. Maybe not very much. Nonetheless, we see the expected relationship between X and Y: sex of the participant and infidelity. The risk of infidelity goes up with relationship duration: a relationship between time and infidelity. These results are not inconsistent with what is seen across the literature.
Here is what she found for pornography use:
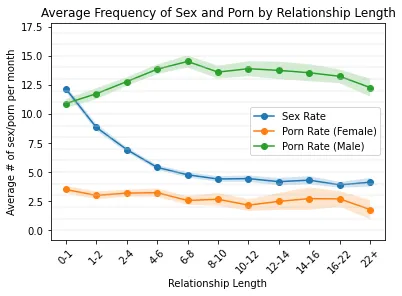
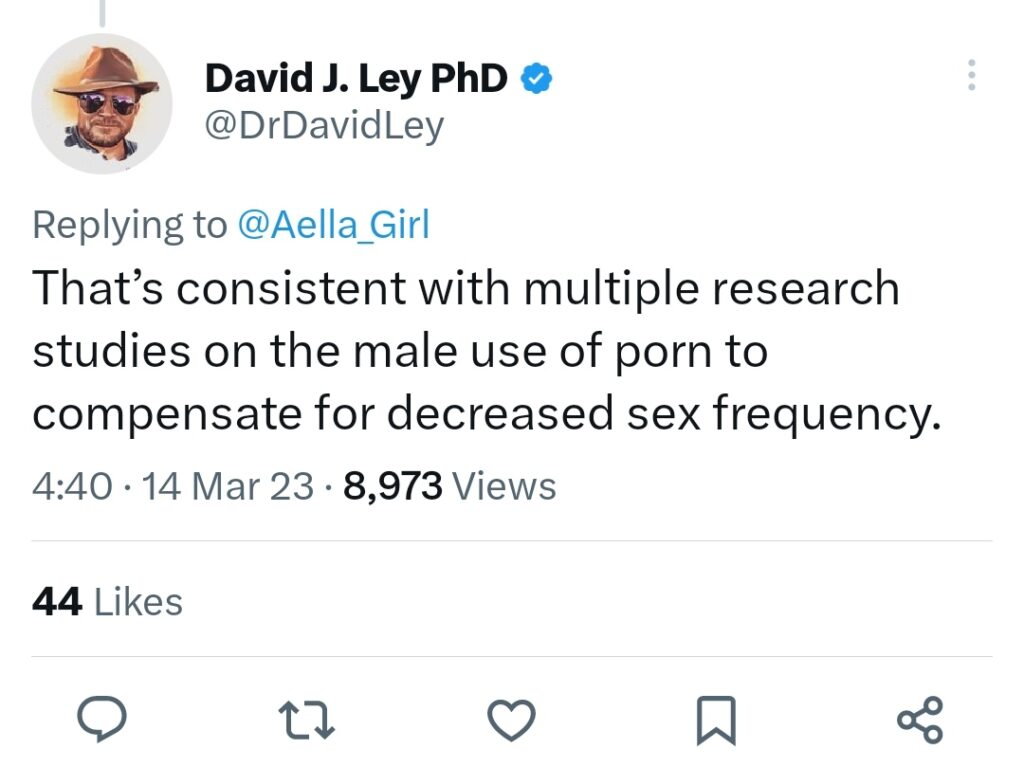
I don’t research pornography so I had no clue if this reflected the existing literature. Fortunately, Dr. David Ley is an expert in this field. We can see what he said: “that’s consistent with multiple research studies on the male use of porn to compensate for decreased sex frequency.” He followed up with a citation on this as well (Fischer & Træen, 2022).
These kinds of results are possible precisely because an effect may exist across populations. We take what we know about one population and see if it resembles another. If we do make guesses about external populations based on past research, we also test them. Every result contributes to a growing body of knowledge.
This raises another point: the purpose of sampling is not to be generalizable to The Population™ that consists of all human beings. Having different samples from different populations is important if you want to see how consistent an effect is.
Every convenience sample is special and unique
We talk about “student convenience samples” as if they are one thing. However, a sample from the University of Toronto is not the same as a sample from the Sorbonne Université in Paris, France. These are two very different populations. In fact, every sample in psychology is highly different from the next. Even in WEIRD (Western, Educated, Industrialized, Rich, and Democratic) samples there is high heterogeneity. And yet, we’re often able to consistently replicate effects (fingers crossed) across all of them.
Take, for example, cross-cultural research. As with most research on human subjects, it mostly consists of convenience samples. Pretty rare to get a representative sample from multiple countries. As we have seen with the TESS, the price would be astronomical. Who participates in these cross-cultural studies? Mostly students in the universities of their respective nations.
Yet, we are able to replicate effects across cultures. For instance, the Dark Triad predicts the same behavioral and personality outcomes across convenience samples found on every continent (Aluja et al., 2022). High scores in the DT are associated with having lower status, regardless of where you live, and regardless of the convenience sample that you use.
I say “we are able to replicate” very optimistically. You may have heard of the replication crisis. This is the observation that across psychology and medicine, about half of findings do not replicate. There is reason for optimism, however, if you are in personality psychology: replication rates may be much higher, around 77% (Youyou et al., 2023). This is not because personality psychology is doing anything special methodologically. The whole field of personality psychology basically boils down to administering questionnaires to convenience samples.
The inability to assume generalizability does not imply inconsistent results
It is a formal fact in statistics that you cannot generalize to a population from a sample that is not drawn from that population. However, many people seem to think this means that an unrepresentative sample will produce different results. That is also an assumption that cannot be made. If you want to know how similar your results may or may not be, all you can do is compare the results across samples.
This is why convenience samples are very valuable. Drawn from different populations, convenience samples let you see how consistent your results are across populations. Does a sample from Twitter produce radically different results from an MTurk sample, a sample of your local college students, or the entire population of the USA? It might, it might not. You don’t know unless you contrast the results of the two.
Further, the more you compare specific items across samples the better you can know if results from one will predict results in the other. For example, having contrasted CFD face ratings with Twitter ratings and seeing that the two were very similar, I might be a little more confident that the denizens of Twitter will give me ratings of faces that predict ratings elsewhere.
Today I saw a Tweet by statistician Daniël Lakens, quoting Hungarian mathematical philosopher Imre Lakatos (1978):
“One single observation may be the stray result of some trivial error: in order to reduce such risks, methodological falsifications prescribe some safety control. The simplest such control is to repeat the experiment.”
This is really a much better way to know if your convenience samples are producing aberrant results, rather than just assuming that they do. Check how well they replicate past findings.
This requires a bit of diligent work on the part of the reader, since we don’t get to just assume that results will be different. We have to know if they actually are different. We have to read up on the literature and know what to expect. How well do the results of one study resemble the results of another? In what ways are they different (or the same) and how might different samples account for that? But never can an assumption be made, ahead of time, that the results are or will be different.
What population are you really interested in, anyway
A representative sample of the entire US population may even be of little interest to you. Imagine you are studying dating behavior on Tinder. Not as a researcher, but as a 24-year-old man who is in the market. Do you want to know how the entire population of the USA behaves on dating websites? Probably not. You might actually be more interested in how men or women within your age demographic behave.
This is great for researching dating, because convenience samples overlap heavily with people who date: young adults. “But those are people on Twitter,” says a Zoomer on social media, who is probably going to date someone who uses the same social media platform. This is the exact same demographic of people that you regularly interact with. It’s highly likely to overlap with your own dating pool. This makes it a population of interest to you, even if it isn’t representative, the same way a population with Alzheimer’s disease is unrepresentative of the general population but is nonetheless of interest to people studying Alzheimer’s disease. Would it really be better if we made sure every sample of young daters had its requisite number of geriatrics in order to be more representative of the US population?
The Twitter skeptics
In a recent survey on my own Twitter account, about 80% of the participants had a university education. About a third who follow my account are academics. The feedback that I have gotten from academics following survey results I have published on this website has been overwhelmingly positive. It is massively encouraging.
What I don’t see from academics is: “a Twitter poll is unrepresentative.” Not because it isn’t true. It is true. It’s also an observation that is entirely obvious and mundane. Regurgitating this factoid that applies to 95% of all human research just isn’t that insightful. It’s not the nail-in-the-coffin some people seem to think that it is. Researchers like data, they like to see how it compares to the data they are already familiar with, and they care surprisingly less about the pageantry surrounding it than the average Reddit science fan. Given publish or perish, profiteering journals, and the overwhelming distaste for the peer review process in academia, I think a great deal of researchers would love to be able to just run a survey and put their own papers on a blog.
So who are the Twitter skeptics? Mostly, people who don’t care what data says at all. A mere critique of methodology produces no evidence, but it’s quite useful when you hold strong opinions that you don’t want to let go of. “The data is imperfect, therefore I will continue believing whatever I believe that is based on absolutely nothing.” Notably, for most of my articles I have relied heavily on representative data sets. I still get these types of responses nonetheless. People often won’t shift their beliefs regardless of the quality of your data, particularly if those beliefs were not informed by data to begin with.
This means that the problem is not unrepresentative data. That would be the case if the data dredged up a result that was wildly different from the rest of the literature. Then you could look at it and say: “this is very different, probably because your sample is very different.” But often, that is not what is happening. Rather, it’s “I don’t like what the data shows and I have prior beliefs that I do not want to change.”
References
Aluja, A., Garcia, L. F., Rossier, J., Ostendorf, F., Glicksohn, J., Oumar, B., … & Hansenne, M. (2022). Dark triad traits, social position, and personality: a cross-cultural study. Journal of Cross-Cultural Psychology, 53(3-4), 380-402.
Antoun, C., Zhang, C., Conrad, F. G., & Schober, M. F. (2016). Comparisons of online recruitment strategies for convenience samples: Craigslist, Google AdWords, Facebook, and Amazon Mechanical Turk. Field methods, 28(3), 231-246.
Baker, R., Brick, J. M., Bates, N. A., Battaglia, M., Couper, M. P., Dever, J. A., … & Tourangeau, R. (2013). Summary report of the AAPOR task force on non-probability sampling. Journal of survey statistics and methodology, 1(2), 90-143.
Boas, T. C., Christenson, D. P., & Glick, D. M. (2020). Recruiting large online samples in the United States and India: Facebook, mechanical turk, and qualtrics. Political Science Research and Methods, 8(2), 232-250.
Cleophas, T. J., Zwinderman, A. H., Cleophas, T. J., & Zwinderman, A. H. (2012). Clinical trials do not use random samples anymore. Statistics Applied to Clinical Studies, 479-485.
Coppock, A., & McClellan, O. A. (2019). Validating the demographic, political, psychological, and experimental results obtained from a new source of online survey respondents. Research & Politics, 6(1), 2053168018822174.
Fischer, N., & Træen, B. (2022). A seemingly paradoxical relationship between masturbation frequency and sexual satisfaction. Archives of Sexual Behavior, 51(6), 3151-3167.
Jager, J., Putnick, D. L., & Bornstein, M. H. (2017). II. More than just convenient: The scientific merits of homogeneous convenience samples. Monographs of the Society for Research in Child Development, 82(2), 13-30.
Langlois, J. H., Kalakanis, L., Rubenstein, A. J., Larson, A., Hallam, M., & Smoot, M. (2000). Maxims or myths of beauty? A meta-analytic and theoretical review. Psychological bulletin, 126(3), 390.
Kish, L. (1965). Survey sampling.
Lakatos, I. (1978). Falsification and the methodology of scientific research. Philosophical papers, 1, 1-7.
Mullinix, K. J., Leeper, T. J., Druckman, J. N., & Freese, J. (2015). The generalizability of survey experiments. Journal of Experimental Political Science, 2(2), 109-138.
Peterson, R. A. (2001). On the use of college students in social science research: Insights from a second-order meta-analysis. Journal of consumer research, 28(3), 450-461.
Szucs, D., & Ioannidis, J. P. (2020). Sample size evolution in neuroimaging research: An evaluation of highly-cited studies (1990–2012) and of latest practices (2017–2018) in high-impact journals. NeuroImage, 221, 117164.
Vitriol, J. A., Larsen, E. G., & Ludeke, S. G. (2019). The generalizability of personality effects in politics. European Journal of Personality, 33(6), 631-641.
Ward, E. A. (1993). Generalizability of psychological research from undergraduates to employed adults. The Journal of Social Psychology, 133(4), 513-519.
Youyou, W., Yang, Y., & Uzzi, B. (2023). A discipline-wide investigation of the replicability of Psychology papers over the past two decades. Proceedings of the National Academy of Sciences, 120(6), e2208863120.
2 comments
Am I blind or is Mullinix et al. (2015) a very clear example of when a funnel plot would reveal publication bias?
Why is there so much variance in >0 results and almost a complete void in anything under 0?
Thank you, Alexander, for shedding light on the topic of convenience samples and their role in research. It’s crucial to understand that while convenience samples may not be representative of the entire population, they can still yield valuable insights and produce consistent results. The examples you provided, such as the comparison of convenience samples with nationally representative samples, demonstrate the reliability of convenience sampling in certain contexts. This article challenges the assumption that unrepresentative samples will automatically yield different results, emphasizing the importance of replication and comparing findings across different samples. Well done!