Enjoy DatePsychology? Consider subscribing at Patreon to support the project.
To begin, I would like to start with a working definition of two terms: age gap relationships and hierarchical relationships.
Age gap relationships broadly refer to romantic or sexual relationships where one partner is substantially older. Hierarchical relationships refer to relationships where one partner is in a superior position, typically in an organization involving employment or the university.
Age gap or hierarchical relationships are not homogeneous. For example, in one relationship the gap may be five years, while in another it is fifteen. In a hierarchical relationship, a manager may wield less power than the owner of a company.
Age gap relationships are common. A representative Ipsos poll (2022) found that 39% of Americans have dated someone with an age gap of 10 years or more. Further, 28% of women reported dating someone ten years older or more. Despite the taboo, age gaps are a feature of the romantic landscape.
Hierarchical relationships seem to be almost as common, despite being even more taboo. The Society for Human Resource Management (2020) found that approximately 13% of Americans have dated a boss. Two earlier studies, albeit dated now, found high rates of hierarchical relationships in the university as well. Pop et al. (1979) found that 25% of female students reported having a sexual relationship with a faculty member, while Glaser and Thorpe (1986) found that 17% had formed a romantic relationship with a professor.
If this surprises you, keep in mind that we are talking about adults. Additionally, most universities still do not prohibit student-faculty relationships (Nystrom & Richards, 2022a; 2022b). A well-replicated finding in the psychology of relationships is that people mate assortatively. Part of the reason for this is the shared environment. Your dating pool is essentially limited to those in your immediate proximity. As such, perhaps it should not be too surprising that hierarchical relationships form frequently in academia.
Nonetheless, the taboo persists. There is a cultural narrative of “power imbalances” that is as strong as ever. There is a belief that when power exists, consent cannot. Outside the scope of consent, there is a legitimate question as to what extent age hierarchical relationships may be unfair for others in the immediate environment (favoritism, for example).
Relatively little research has been done on age gaps or hierarchical relationships. Of what does exist, it seems consistent that third-party observers view these relationships somewhat negatively (Ei & Bowen, 2002; Pottschmidt, 2021). Even less research has been done on individuals who are in age gap or hierarchical relationships themselves. Here, the trend reverses. For example, in the few studies examining college students who have dated professors, most reported positive experiences (Glaser & Thorpe, 1986; Skeen & Nielsen, 1983; Bellas & Gossett, 2001).
This should not be too surprising. Those opposed to hierarchical or age gap relationships will self-select out of them. Those who have more positive attitudes will self-select into them; further, their positive experiences may shape their perceptions of those relationships more broadly. Indeed, Skeen and Nielsen (1983), as well as Bellas and Gossett (2001), both found that students were more likely to pursue professors than vice versa. Ultimately, the experiences of people in differential relationships seem to be different from the opinions held about them by those on the outside looking in.
Methods
I administered a survey to assess attitudes towards age gap and hierarchical relationships. In this, I asked participants to report their largest age gap relationship, their ideal age gap, and if they had ever been in a hierarchical relationship with either a boss or a university professor.
To assess attitudes toward age gaps and hierarchical relationships, I used single item vignettes describing either a gap in age between a couple or a hierarchical relationship.
Personality Variables
For personality variables, I included items from a Belief In A Hostile World (BHWS) scale, a recent Social Dominance Orientation (SDO) scale, and the Dark Triad (DT) “dirty dozen” scale. I also included a measure of political ideology from left to right.
Why these scales? Belief in a hostile world describes a tendency, as the name implies, toward seeing the world as a hostile place. We might expect that this is related to strong attitudes toward age gap or hierarchical relationships as predatory or exploitative.
Social dominance orientation, on the other hand, measures support for social hierarchies, aggressive favoritism toward in-groups, and is closely associated with anti-egalitarianism. We might expect people more favorably disposed to power, dominance, and hierarchy to be more supportive of age gaps and hierarchical relationships.
The Dark Triad is a measure of subclinical antisocial personality. This predicts manipulative, exploitative, self-centered, and predatory behavior. A common belief about age gaps, or hierarchical relationships, is that they are predatory. If so, we might expect the Dark Triad to predict support.
Political ideology might also predict sentiment toward age gaps and hierarchical relationships. A common belief is that opposition is associated with feminism. At the same time, some people view larger age gaps as a part of a “traditional” relationship structure.
Results
Descriptive Statistics
The total number of participants was 346; approximately 70% of respondents were male. Average age was around 30 with a fairly wide range. Political ideology had a pretty even left/right split.
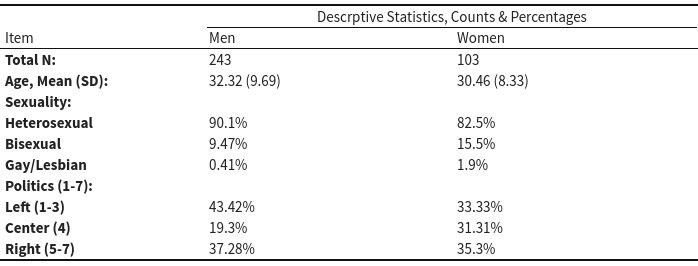
Consistent with the general trend in the literature, men are more likely to desire a partner who is younger while women are more likely to desire a partner who is older.
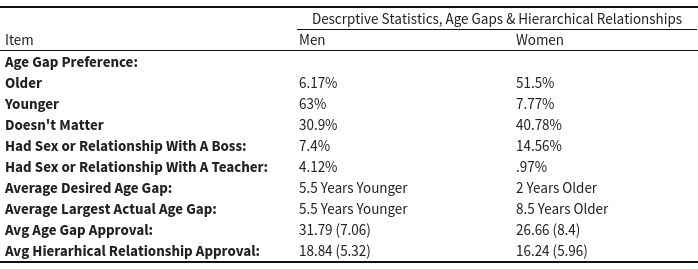
In my sample, a smaller percentage of participants reported having a relationship with a professor, in contrast with the research cited in the introduction. It’s probably not the case that one out of four people are really hot for teacher. Only 3.4% of my total sample (4.12% men, .97% women) reported having had sex or a relationship with a professor. For sex or a relationship with a boss, the responses were closer to the Society for Human Resource Management (2020) estimate of 13%.
More consistent with past research is the desired age gap. Very few women reported desiring a younger partner, while a majority of men preferred a younger partner. This is also consistent with the direction of desired age gaps reported as numbers, as well as the average of actual largest age gaps reported by participants. On average, men report desiring younger partners and also date younger partners. Conversely, on average, women report a desire for and date older partners.
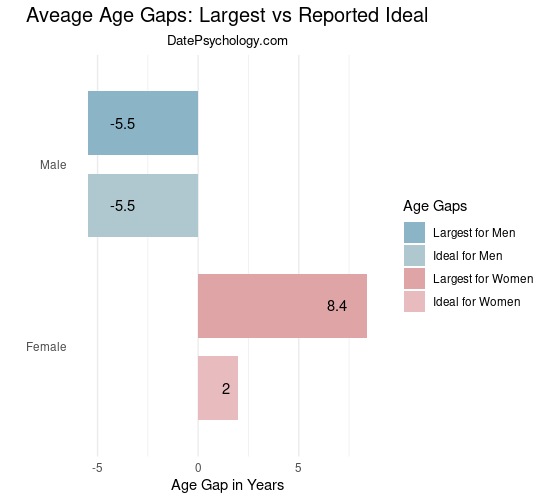
The chart above shows the average of the ideal reported age gap and the largest age gap in any past relationship. In this data, 31% of women reported having been in a relationship with an age gap that was ten or more years. As reported in the introduction, nationally representative data has found that approximately 39% of Americans have dated someone with an age gap of ten years or more (Ipsos, 2022). For men in my survey, however, only 18.5% reported having been in a relationship with an age gap of ten or more years.
Support for Age Gaps and Hierarchical Relationships
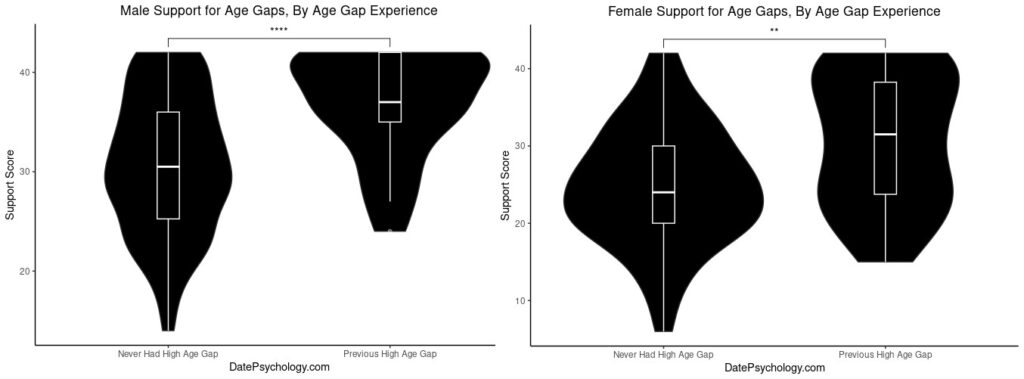
A total support score was calculated for age gap approval and hierarchical relationship approval, derived from a sum of the individual ratings of vignettes describing age gaps and hierarchical relationships. A t-test was conducted to compare the mean scores for hierarchical relationship approval for men (M = 18.84) and women (M = 16.24). Men indicated significantly higher approval for hierarchical relationships than women (M = 16.24), (t(174.18) = 3.82, p < .001, 95% CI [1.25, 3.93]). Age gap approval had the same direction for men (M = 31.79) and women (M = 26.66). Men approved of age gap relationships significantly more than women (M = 26.66), t(165.85) = 5.43, p < .001, 95% CI [3.26, 6.99]).
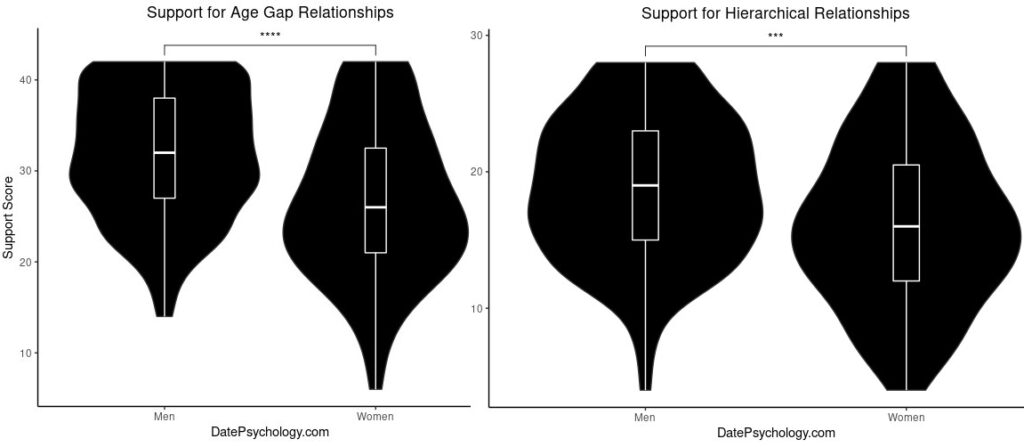
The effect size for sex on approval was medium for hierarchical relationships (d = .68) and small for age gap relationships (d = .47). I report these as “small” and “medium” according to the effect size conventions of Cohen (1988), but in individual difference research they are actually much larger than we usually see. Gignac & Szodorai (2016) report that a “large” convention for personality psychology should be approximately d = .29 and that < 3% of effect sizes in individual difference research are larger than d = .5. In any case, this is a substantial sex difference in perceptions of hierarchical and age gap relationships.
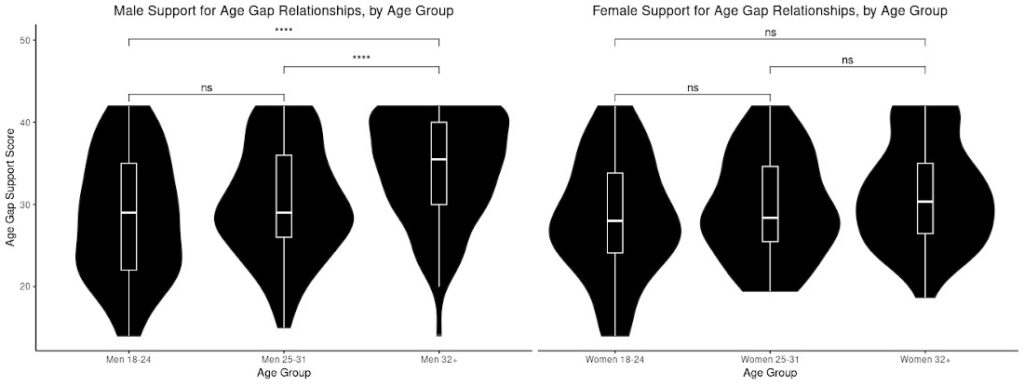
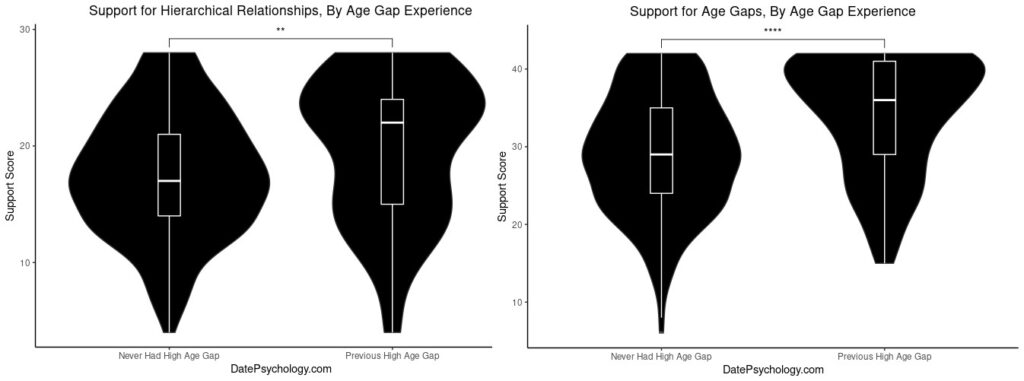
When I posted the chart above for age gap relationships on Twitter, some people had questions about interpreting a violin plot. Violin plots allow you to visualize the distribution of the data. They are essentially box plots with a distribution underlay. Where the plot is “fat” indicates where most of the scores by individual participants reside. The bar is the median score, while the box indicates the interquartile range. Here is a short article explaining the parts of a violin plot. Important going forward, because I will use these throughout this article.
Desired Age Gaps
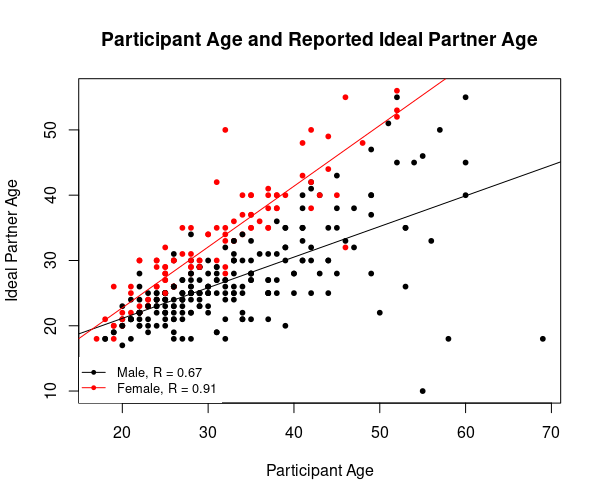
The chart below shows the stated ideal partner age by participant age. For women, age closely predicts ideal partner age. Women tend to state that their ideal partner is close to their own age. For men, there is also a relationship with participant age and ideal partner age, but the relationship is not as tight. Men prefer younger partners on average and ideal partner age also becomes more varied as age increases.
The Effect of Age on Age Gap and Hierarchical Relationship Support
I divided my data into three groups: young adults (18-24), middle adults (25-31) and older adults (32+). I then separated the data into male and female to analyze separately with ANOVA.
For men, there was a significant main effect of age group, (F(2, 240) = 15.08, p < .001). Post-hoc comparisons using Tukey’s HSD test indicated that the mean age gap approval score for older men was significantly higher than both the young adult male (mean difference = 5.77, p < .001) and the middle adult male group (mean difference = 3.97, p < .001). However, there was no significant difference in age gap approval scores between the young adult male and middle adult male groups (mean difference = 1.80, p = .293).
For women, the ANOVA was not significant (F(2, 100) = 1.687, p = 0.19). In other words, the analysis did not detect a difference in support for age gaps between young adult, middle adult, and older adult women. The post-hoc test results revealed that there were no significant mean differences between the young adult female and middle adult female groups (diff = 1.67, 95% CI [-3.47, 6.82], p = 0.72), the young adult female and older adult female groups (diff = 3.67, 95% CI [-1.15, 8.50], p = 0.17), or the middle adult female and older adult female groups (diff = 1.99, 95% CI [-2.64, 6.64], p = 0.56).
I followed this up with a Bayesian ANOVA to quantify evidence for the null. The analysis yielded a Bayes factor of 0.36, indicating that the data are approximately three times more likely under the null hypothesis (i.e., no effect of age group) than under the alternative hypothesis. The uncertainty of the Bayes factor estimate is very low (BF = 0.36 ± 0.03%).
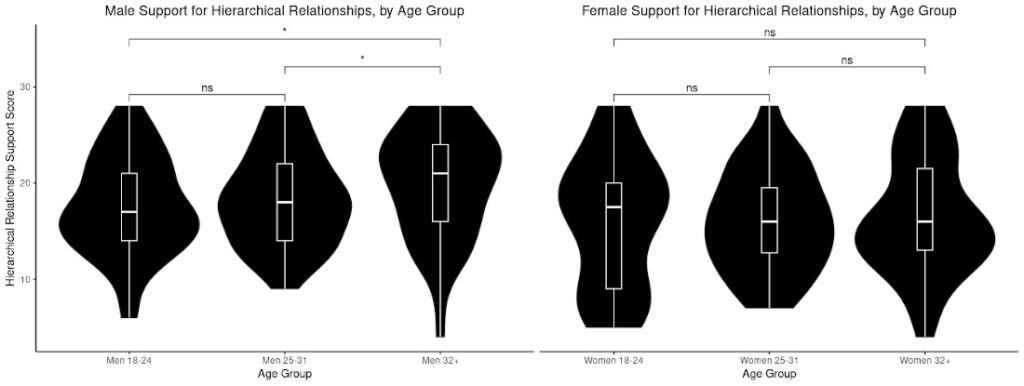
In support of hierarchical relationships, there was a significant effect of age group for men (F(2, 240) = 4.031, p = 0.019). Post-hoc pairwise comparisons indicated that older men had significantly higher approval scores (M = 8.23) compared to younger men (M = 6.87, p = 0.03), and there was no significant difference between middle adult men (M = 7.64) and either young men or older men.
For women, age was not significant (F(2, 100) = 0.091, p = 0.913). Post-hoc analysis did not reveal any significant pairwise differences in support for age gap relationships between female age groups. Bayesian ANOVA yielded a BF of 0.098 ±0.02%, or in other words the data are approximately 10 times more likely under the null hypothesis.
Age Gaps, Hierarchical Relationships, and Politics
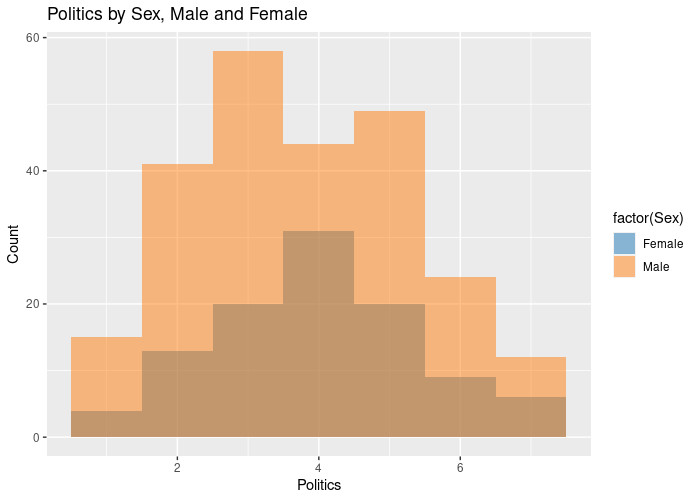
Participants indicated their political ideology on a left-to-right scale of 1-7, with 1 being very left wing and 7 being very right wing. As shown in the descriptive statistics table, the sample did not have a strong skew left or right. Here is the distribution of responses for men and women on the political ideology item:
To examine the relationship between political ideology and age gaps, I selected the men and women who have had an age gap relationship of 10+ years.
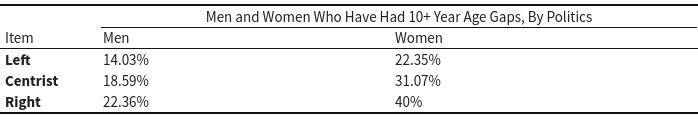
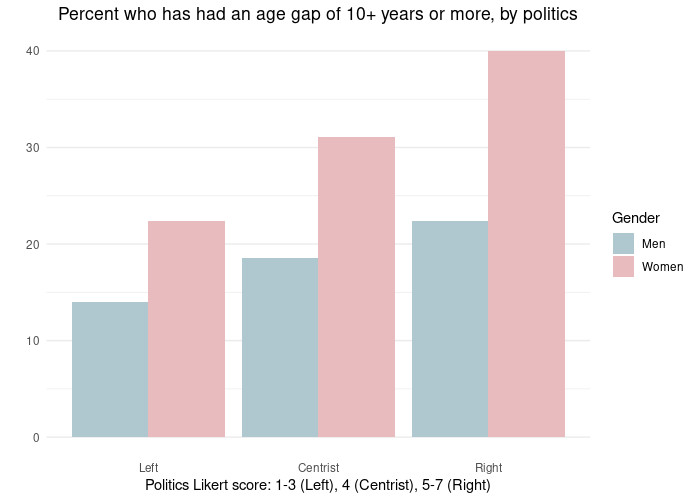
This looks like a clear pattern, but running a one-way ANOVA the results are not statistically significant for an effect of political grouping on having had a large age gap (F(2, 74) = 0.124, p = 0.884, MSE = 65.64, partial eta squared = 0.003). A Tukey post-hoc test also did not find significant differences between groups.
I followed this up with a Bayesian ANOVA since we can see what looks like a difference in the chart. The Bayes factor analysis using a JZS prior provided strong evidence in favor of the null hypothesis (BF10 = 0.04, ±0.01%), indicating that the alternative hypothesis is 25.2 times less likely than the null hypothesis (no difference by politics). This also suggests that the politics variable did not have a significant effect on having had a large age gap.
Running an ANOVA by political grouping for the full dataset (not just participants who had a 10+ year age gap) I also found the result was not significant (F(2, 343) = 0.952, p = 0.387, partial eta squared = 0.0287). A Tukey post-hoc comparison did not show any significant differences between groups.
A Bayesian ANOVA for the full data set yielded strong evidence in support of the null hypothesis, with a Bayes factor of 0.0228 (BF_01 = 0.0228, ±0.01%). This indicates that the evidence in favor of the null hypothesis (no difference among the groups) is 43.79 times stronger than the evidence in favor of the alternative hypothesis (i.e., a difference among the groups).
Perhaps surprising results given the way the chart looks! A lesson in how charts can be misleading at a first glance nonetheless. For age gaps at 10+ years, each group only contained 19, 25, and 33 participants (Left, Centrist, and Right respectively). Not much power to detect an effect.
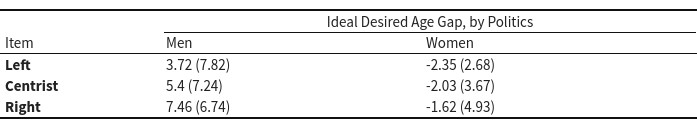
We can also test the relationship between political ideology and the ideal age gap. Do conservative men desire a larger age gap? In my data, yes. For every 1 unit increase in my politics variable (from left to right), the ideal age gap increased by .89 years (β = 0.891, t(241) = 3.064, p = 0.002). However, the relationship was not significant for women. As you can see in the table below, the average desired age gap for women is very similar regardless of politics.
Hostile World Beliefs, Social Dominance Orientation, and the Dark Triad
Here are descriptive statistics for the personality variables I used:
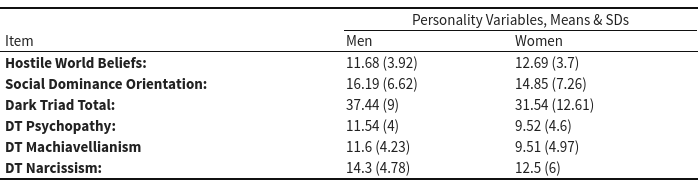
A Wilcoxon rank-sum test didn’t reveal a significant difference by sex for SDO (W = 10932, p = 0.06257), but did find a significant difference for HWBS (W = 14471, p = 0.0211) and the Dark Triad (W = 8193, p < .001). That men score higher in the DT is a well-replicated finding in psychology (Luo et al., 2022), so this is an expected result.
Hostile world beliefs did not predict support for age gaps (β = -0.1451, t(344) = -1.336, p = 0.182., Adj-R² = 0.002) nor support for hierarchical relationships (β = -0.07813, t(344) = -0.999, p = 0.318., Adj-R² = -0.00000421).
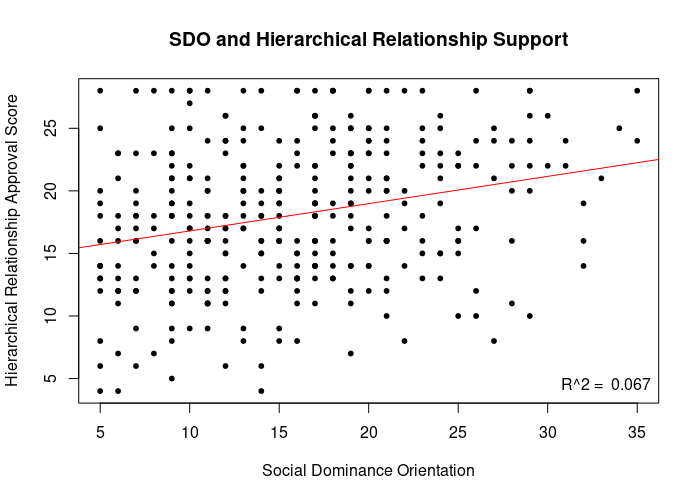
Social dominance orientation significantly predicted support for age gaps (β = 0.21308, t(344) = 3.511, p < 0.001, Adj-R² = 0.03179) and hierarchical relationships (β = 0.21798, t(344) = 5.089, p < 0.001., Adj-R² = 0.06731).
The Dark Triad also significantly predicted support for age gaps (β = 0.13425, t(344) = 3.413, p < 0.001, Adj-R² = 0.02994) and hierarchical relationships (β = 0.09289, t(344) = 3.28, p < 0.001, Adj-R² = 0.0275).
We see significant results for SDO and the DT: higher scores predict higher support for hierarchical and age gap relationships. These are significant, although the effect is not large (you can see this in the Adj-R²). About 2-7% of the variance in support is explained by the independent personality variables I selected. Here is what the association looks like for the strongest relationship, social dominance orientation and hierarchical relationship approval:
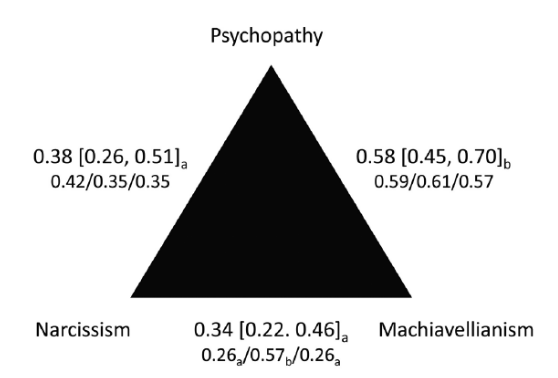
The Dark Triad is composed of three facets: narcissism, Machiavellianism, and psychopathy. Narcissism is characterized by an excessive focus on one’s own self-importance, a sense of entitlement, and a lack of empathy for others. Machiavellianism is characterized by a willingness to manipulate others for personal gain, a focus on self-interest and a lack of regard for ethical principles. Psychopathy is characterized by a lack of empathy or remorse, impulsive behavior, and a tendency to engage in reckless or criminal activities.
These three traits are correlated. A meta-analysis by Muris et al. (2017) put the correlations between traits from .34 to .58. In my sample, the correlation between psychopathy and Machiavellianism was .44 (.58 in Muris et al., 2017), psychopathy and narcissism was .15 (.38 in Muris et al., 2017), and Machiavellianism and narcissism was .42 (.34 in Muris et al., 2017).
As the Dark Triad is not just one thing, it’s possible that the individual facets predict support for age gaps or hierarchical relationships differently.
I used a multiple linear regression to examine the relationship between individual DT facets and participants’ support for hierarchical relationships. The model was statistically significant, F(3, 342) = 4.731, p = 0.003. The model accounted for 3.99% of the variance in support for hierarchical relationships, adjusted R² = 0.03142. Psychopathy was a significant positive predictor of support for hierarchical relationships (β = 0.21670, t(342) = 2.786, p = 0.006), whereas Machiavellianism (β = 0.05204, t(342) = 0.652, p = 0.515) and narcissism (β = 0.04046, t(342) = 0.643, p = 0.52) were not significant predictors.
The result was similar for age gap approval, with psychopathy emerging as the only significant predictor. The model was significant at F(3, 342) = 5.459, p = 0.001, R² = 0.046. Psychopathy had a significant positive relationship with age gap approval (β = 0.342, t(342) = 3.175, p = 0.002). However, Machiavellianism (β = 0.046, t(342) = 0.416, p = 0.677) and narcissism (β = 0.065, t(342) = 0.744, p = 0.457) did not have a significant relationship with age gap approval.
It’s usually the case that you find small effects in psychology, particularly when examining a single variable. Behavior and personality are complex and multivariate. What happens if we look at a conjunction of variables?
I ran a multiple regression that included all variables in my dataset. VIF values for multicollinearity all ranged from 1.2 to 1.9, with the exception of reported ideal age gap at 2.2, indicating low multicollinearity between variables (below 5 the conventionally considered acceptable). I used the ols_step_best_subset function in R to perform a best subset regression analysis. This function performs a stepwise comparison of models to find the variables that produce the best fit regression model.
For age gap support, a multiple regression consisting of psychopathy, SDO, HWBS, sex, age, and largest ever age gap produced the best model. The overall model was significant, F(6, 339) = 18.82, p < .001, Adj R² = .24. The predictor variables psychopathy (β = .19, t(339) = 2.01, p = .045), SDO (β = .20, t(339) = 3.33, p = .001), male sex (β = 4.83, t(339) = 5.54, p < .001), age (β = .13, t(339) = 2.97, p = .003), and having had a large age gap (β = .28, t(339) = 4.59, p < .001) were found to be significant predictors of age gap approval. However, HWBS (β = -.20, t(339) = -1.91, p = .057) was not a significant predictor of age gap approval. Together, these variables explain 24% of the variance in support for age gaps.
For hierarchical relationship support, a stepwise search produced a best fit model consisting of psychopathy, SDO, HWBS, sex, largest ever age gap, and ideal age gap. The model was statistically significant (F(6, 339) = 13.03, p < .001) and explained 18.74% of the variance in hierarchical relationship approval. The results suggest that SDO (β = 0.21, p < .001), largest ever age gap (β = 0.14, p = .001), and ideal age gap (β = 0.11, p = .018) were significant positive predictors of hierarchical relationship approval, while HWBS (β = -0.19, p = .013) was a significant negative predictor of hierarchical relationship approval. Psychopathy (β = 0.12, p = .086) and sex (β = 1.46, p = .053) were not found to be significant predictors of hierarchical relationship approval.
We can ask another question as well: do these personality traits predict a desire for a larger age gap? A regression model with social dominance orientation, the Dark Triad, and HWBS for men did not predict a desire for larger age gaps for men (F(3, 239) = 1.199, p = 0.31) nor for women (F(3, 99) = 2.271, p = 0.085).
That’s a lot of stuff — what does it mean in a practical sense? Well, for example, if you take men who are older, who score higher in psychopathy and social dominance orientation, and who don’t see the world as a hostile place, it’s a bit more likely they will support hierarchical relationships and age gaps. Importantly, this is not the same as saying all or even most people who are supportive of these relationships are socially dominant psychopaths (in fact, we will see in this data set that most people are neutral or supportive of most hierarchical and age gap relationships). Nonetheless, we do see a relationship with this conjunction of variables.
Actual Age Gaps and Support
From the regression models we have an idea of what traits predict support for age gaps and hierarchical relationships. We can use that to answer another question: do these predict actual engagement in age gaps or hierarchical relationships? I asked two questions with a binary response: have participants had a relationship with a boss and have participants had a relationship with a teacher. Additionally, I grouped participants into high and low age gap groups based on who has had an age gap of over ten years.
Actual Gaps & Hierarchical Relationships
After creating my large vs small age gap groups, I conducted a binary logistic regression to predict having been in a large age gap relationship. I performed this independently for men and women and selected the variables indicated in the previous regression: psychopathy, social dominance orientation, hostile world beliefs, and age. Participant age was a significant predictor of having been in an age gap relationship (b = -0.089, SE = 0.018, Wald χ^2 (1) = 25.89, p < .001), such that younger age was associated with lower odds of reporting having had a large age gap. None of the other predictors were significant (all ps > .05). For women, the predictor variables were also not significant except for age (b = -0.14, SE = 0.03, Wald Z = -4.04, p < .001).
The same trend emerged for having dated a boss: only age predicted having dated a boss for men (b = 0.056, SE = 0.022, Wald = 2.576, p = 0.01) and for women (b = 0.089, SE = 0.035, Wald = 2.580, p = 0.01). None of the variables were significant in predicting having dated a teacher.
Did people who were in age gap relationships also show more support for age gap relationships? The mean age gap approval score for participants who reported having had a sexual or romantic relationship with a teacher (M = 33.91) was slightly higher than for those who did not (M = 30.14), but this difference was not statistically significant (t(10.569) = -1.462, p = .173). The age gap approval score for participants who reported a relationship with a boss (M = 31.82) was slightly higher than for those who did not (M = 30.10), but again, this difference was not statistically significant (t(38.66) = -1.175, p = .247). However, the relationship was significant for participants in the high (M = 34.17) versus low (M = 29.14) age gap category (t(125.05) = 5.208, p < .001. CI [3.1, 6.1]). Perhaps unsurprisingly, participants who engaged in age gap relationships were also more supportive of age gap relationships.
What about support for hierarchical relationships? Again, having a relationship with a teacher (t(10.918) = -1.2164, p = 0.2495), or with a boss (t(38.219) = -1.3597, p = 0.1819) did not predict support. Having had a past age gap did predict support, however. There was a significant difference in hierarchical relationship approval scores between those who previously had an age gap of ten years or more and those who did not (t(110.57) = 2.8961, p = 0.0046, CI [0.713, 3.801]).
This is across the whole group. We have seen previously that men are more supportive of age gaps than women are. Might it also be the case we see a difference between men and women who have been in age gap relationships?
For participants only who had age gaps of ten years or more, the mean hierarchical relationship approval score for women (M = 18.56) was lower than the mean score for men (M = 20.71), however this relationship was not statistically significant (t(67.82) = -1.52, p = 0.134). For age gap approval, the mean score for women (M = 30.66) was significantly lower than the mean score for men (M = 36.67), (t(47.48) = -3.51, p = 0.001).
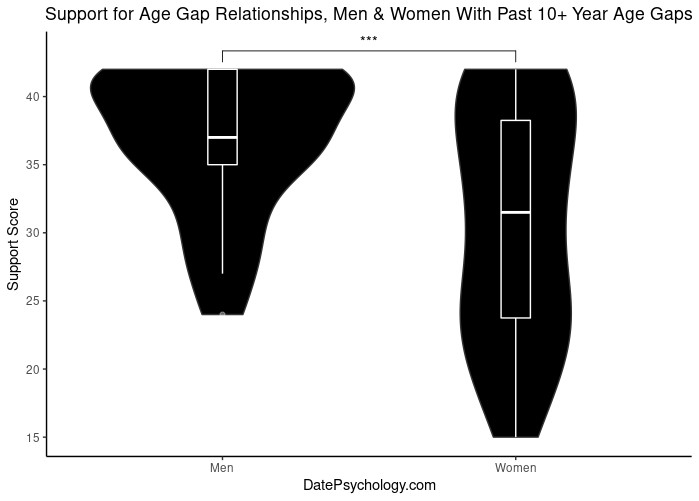
Men who previously had a large age gap relationship were overwhelmingly supportive of age gaps in principle. However, women who had a large age gap relationship were more varied in their approval. I didn’t ask about individual experiences within age gap relationships, but this might indicate higher variation in positive or negative experiences of women who have had age gap relationships.
This raises another question — are there within-sex differences for men and women who have been in large age gaps versus those who have not?
Men who have had age gaps of ten years or more (M = 36.67) were much more supportive of age gaps than men (M = 30.66) who have not (t(82.51) = 6.44, p < .001, 95% CI [4.14, 7.84]). This is quite a large effect, with a Cohen’s d of .9 (95% CI [0.562, 1.232]). Women who have had age gaps (M = 30.65) similarly were more supportive of age gap relationships than women (M = 24.86) who have not (t(54.438) = 3.2654, p = 0.002, 95% CI [2.24, 9.356]). This was also a large difference, although a smaller effect than that for men; Cohen’s d of .72.
Age Gaps, Power Dynamics, And Vignette Age
The vignettes I used described relationships with men and women of different ages. For example, a woman who is 20 and a man who is 25 have the same age gap as a woman who is 25 and a man who is 30. How might this affect perceptions of age gaps?
Unsurprisingly, when the woman is younger the relationship is met with less approval, even if the magnitude of the gap is the same. The mean approval score for an age gap between a man of 30 years and a woman of 25 years was 6, while the mean approval of a man who was 40 and a woman who was 35 was 6.3 (t(677.53) = -2.8861, p = 0.004). Nonetheless, this is a relatively small effect (d = -.22) and approval for both was high: the maximum approval score being a 7.
For a 10-year age gap, approval for the relationship between a woman who is 20 and a man who is 30 received a mean rating of 4.32, while a relationship between a woman who is 30 and a man who is 40 received a mean rating of 5.92 (t(628.43) = -12.647, p < .001, d = -.96).
This final comparison is unbalanced: a 15 year age gap between a woman who is 25 and a man who is 40, compared with a 20 year age gap between a woman who is 20 and a man who is 40. Unsurprisingly, the larger age gap with the younger woman was met with less approval. The 15-year gap had a mean score of 4.34 while the 20-year gap had a mean score of 3.27 (t(689.53) = -7.008, p < .001, d = -.53).
I didn’t set these questions up very well to do an ANOVA to test for age x gap interactions, but we can look at charts by the magnitude of the gap and by the age of the woman:
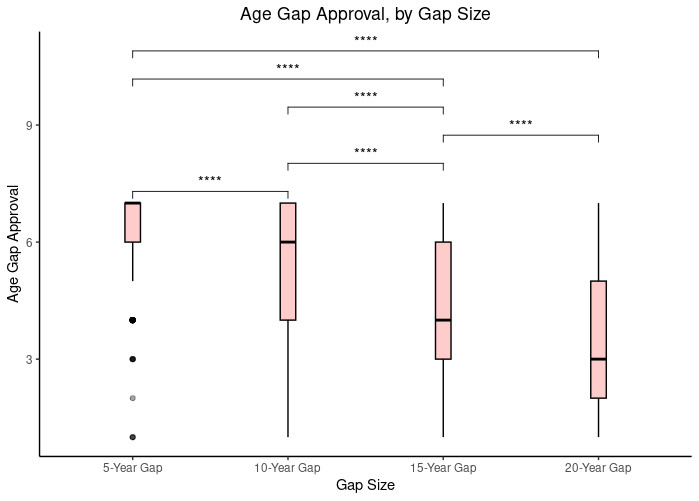
Here we see a pretty clear pattern — larger gaps, lower approval. Almost no one gives a hoot about a 5-year age gap. Even a 10-year age gap still retains a high approval score. When the age gap is larger than that, however, approval ratings drop off.
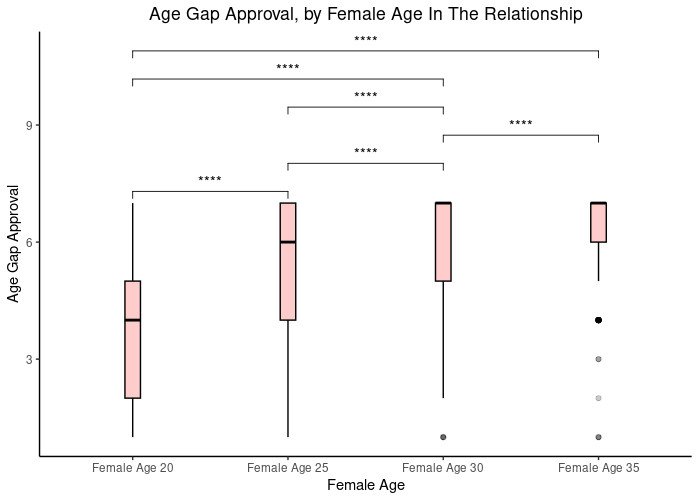
Here is the chart for approval of relationships by the age of the woman in the relationship. The older the woman, the more approval there is for the relationship:
Here are four items I presented to assess hierarchical relationship support:
- A 30-year-old junior professor is dating a 26-year-old graduate student in the same university.
- A 27-year-old McDonald’s manager is dating a 24-year-old drive-through employee.
- A very famous 48-year-old movie star is dating a 19-year-old professional model.
- The 71-year-old president of a large country is married to a woman who is 51 years old.
I based item #1 on the limited past research I have read on university student-teacher relationships: most seem to involve a graduate student and a junior professor of a similar age. Item #2 is representative of an average workplace relationship, while items #3 and #4 are based on real people who are famous. You may recognize them.
Which of these questions has the highest power imbalance? It’s a little subjective, but in my opinion items #2 and #4 do. The McDonald’s employee is under direct supervision and they are in the most financially precarious position. Meanwhile, the relative power imbalance between the President and his wife is high. Here are the approval ratings by participants of these four vignettes:
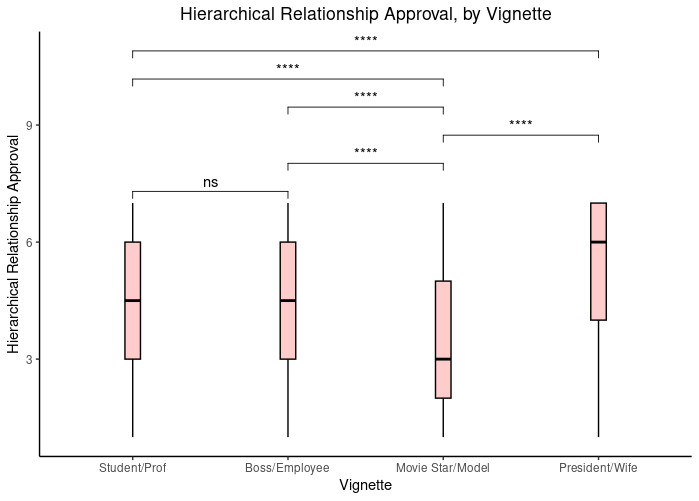
Notably, the relationship with the lowest approval is the one that (in my opinion) also has the lowest institutional power imbalance. However, this vignette also had the largest age gap. I won’t draw any strong conclusions from this, but I do think it calls into question the belief that power imbalances are behind the taboo.
Discussion
Stated Versus Revealed Preferences
The preferred age gap for men and the actual largest age gap were very close. About five years younger. However, for women, the preferred age gap was two years while the actual largest age gap was eight years.
After posting this chart on Twitter, I was able to read feedback and discourse around why this may be. One possible explanation is that many women have had a large age gap, particularly while young, that they have come to regret. An alternate explanation is that women really prefer older men.
I would be cautious about generalizing from the largest ever age gap of participants, which was what I asked for, to a revealed preference in this case. The average age gap in existing relationships is much smaller in representative data on marriages, for example. About two years. We can’t know from my data if women prefer very large age gaps, just because many have had one at one point. In fact, in the stated-vs-revealed preference debate, we really don’t know if revealed preferences represent what people truly want, or what people settle for and actually get.
A better interpretation of this data might be that many women are willing to have a large age gap, at least at some point in their lives, even if a large age gap is not ideal in principle. In other words, a large age gap may not be a deal-breaker, even if it isn’t a feature of the dream relationship.
Men and women who have had age gap relationships of ten years or more also view age gaps more positively. This is not a surprising result: people who see age gaps as highly unfavorable are less likely to have those relationships at all. A self-selection effect.
This is not to say that the picture is clear-cut, however. There were sex differences. Men with past age gap relationships viewed age gaps very positively. Women who had past age gap relationships were much more mixed in their approval. This would be consistent with some of the social media discussion I have seen: women who have had age gap relationships in the past don’t necessarily view them as their preferred relationship form. Experiences may be more mixed.
Age and Intrasexual Competition
I have speculated in the past that intrasexual competition may drive some of the age gap taboo. This has actually made people angry. Really angry. Hate mail angry. However, it is certainly a principle of psychology that people do not understand their own motivations, dispositions, and reasons for beliefs very well. It’s also the case that with many taboos, a visceral emotion precedes the rational explanation for why it is wrong. Cognitively, we create mental explanations after the fact to justify our feelings.
This is not to say that the reactions we have to taboos are baseless or arbitrary. In our common folk psychology, we also underestimate or ignore the role that emotions have in processes of judgment and decision-making. There may be good reasons why taboos emerge even if we aren’t really sure why, or even if the reasons we come up with to explain our feelings aren’t the real explanation for the taboo.
So, intrasexual competition is one idea. As a hypothesis it’s as good as any. I didn’t set out to test this hypothesis with my study design, so as far as support I can’t say much. However, I think the age-approval interaction data may tell us something.
For example, one interpretation of intrasexual competition driving age gap taboos is that older women disapprove because they are competing with younger women. If this is true, then we should expect older women to show lower support for age gaps.
My data didn’t indicate that, however. Across all age groups, women showed similar approval of both age gap and hierarchical relationships. I found no effect of female age on approval. Not great news for the intrasexual competition hypothesis, at least if you believe it is directional from older women to younger women.
Intrasexual competition aside, the data also is inconsistent with other age-related explanations for female disapproval of age gaps: old women are jealous, young women are more grossed out, etc. Whatever the case may be, I didn’t find an effect of age for women.
Not so for men — the oldest men were the most supportive of large age gaps. This could be interpreted through the lens of male intrasexual competition; young men don’t benefit from age gap relationships, but older men do. This is especially pronounced for the youngest age group, 18-24. These men don’t get to date down in age (or they would be dating children), while between 20-30% of the women in this cohort are dating outside of this age range. This leaves a large sex discrepancy: there are not enough single women within this age range for every male to have a partner.
Call it intrasexual competition or not, but it seems like the demographic who may benefit the most from large age gaps are the oldest men. This would be consistent with the data that indicate men age 31+ are more supportive of large age gaps than younger men.
Power Dynamics
A lot of age gap discourse revolves around the so-called power dynamics supposedly inherent in these relationships. This is one of the post-hoc explanations for the taboo that I don’t find very convincing. It might be true that there are power imbalances. However, I don’t think awareness of power drives the taboo. Consistent with this, I did not find a relationship between political ideology and support for age gaps or hierarchical relationships. I did however find a relationship between social dominance orientation, as well as DT psychopathy, and support for age gaps and hierarchical relationships. This may indicate that people who desire a power dynamic may also desire these relationships more.
Yet, these dark traits did not predict who actually ended up having actual age gaps or hierarchical relationships. Further, the relationship between these traits and support for age gap and hierarchical relationships was small. Past research has found that young women are more attracted to Dark Triad traits in men (Qureshi, 2016). However, in my sample I didn’t find that DT traits, SDO, or HWBS predicted a desire for larger age gaps. Perhaps, consistent with past research, individuals with dark traits are simply less picky and thus don’t express strong preferences for age.
Age in my age gap and hierarchical relationship vignettes also seemed to do more heavy lifting than power imbalances. The largest disapproval was associated with vignettes that indicated a large gap with a young woman, regardless of context, rather than vignettes depicting relationships between a boss and an employee, or a professor and a student. Approval of a vignette describing an age gap between a President of a country and a younger wife was high, as was approval of a vignette describing a relationship between a manager and a low wage employee, despite these being the vignettes with the largest real power imbalances (in my opinion).
Dark Personality Traits
As far as I know, no one has examined the relationship between support or desire for age gaps and the Dark Triad, social dominance, or belief in a hostile world. Age gaps are in general understudied, but this seemed like the most obvious question given popular discourse surrounding age gaps: that they are exploitative and desired by predators.
I did find relationships with the DT/SDO and approval of both hierarchical and age gap relationships. In particular, with the psychopathy facet of the Dark Triad. Both are personality constructs associated with desiring power over others, so it does make sense that individuals who score higher in these might be more approving of relationships with a power or age dynamic.
However, these traits did not predict who actually formed age gaps or hierarchical relationships. They also didn’t predict a desire for a larger age gap. Maybe there are some dark personalities who like the idea, but who aren’t forming those relationships nonetheless. Approval of age gaps was also pretty high across the board, so it doesn’t seem to be the case that the only people who might approve (or be in an age gap relationship) are subclinical psychopaths. At the end of the day, people forming less conventional relationships with adult age gaps are probably just normal people who fell in love.
Hostile world beliefs also didn’t predict much in my data. This would have been an alternate explanation — people who see the world as irrationally threatening might also see age gaps as especially pernicious or exploitative. It doesn’t look like we can attribute the age gap taboo to this, either, however. There was a small negative association between HWBS and age gap support for men in my multiple regression model, so it is possible that men who are more supportive of age gaps and hierarchical relationships view the world as a little bit less frightening.
Hostile world beliefs, social dominance orientation, and the Dark Triad are also correlated. In my data, I found an r = .36 for the relationship between SDO and HWBS. As such, it is interesting to see positive relationships with the latter two and a negative relationship with the former. This could indicate that these personality traits work at odds to produce higher support. A sort of “don’t worry about it, the relationships are fine” effect of low HWBS and an effect of dark personality where individuals do approve of these relationships because they actually see them as a way to exercise dominance. Individuals may come to support these relationships for different reasons.
References
Cohen, J. (1988). Statistical Power Analysis for the Behavioral Sciences (2nd ed.). Hillsdale, NJ: Lawrence Erlbaum Associates, Publishers.
Gignac, G. E., & Szodorai, E. T. (2016). Effect size guidelines for individual differences researchers. Personality and individual differences, 102, 74-78.
Ipsos (2022). Many Americans Have Engaged in Age-Gap Dating. https://www.ipsos.com/en-us/news-polls/age-gap-dating
Luo, Y. L., Kovas, Y., Wang, L., Stalikas, A., Kyriazos, T. A., Gianniou, F. M., … & Papageorgiou, K. A. (2022). Sex differences in the Dark Triad are sensitive to socioeconomic conditions: the adaptive value of narcissism in the UK, Greece, and China. Current Psychology, 1-13.
Muris, P., Merckelbach, H., Otgaar, H., & Meijer, E. (2017). The malevolent side of human nature: A meta-analysis and critical review of the literature on the dark triad (narcissism, Machiavellianism, and psychopathy). Perspectives on psychological science, 12(2), 183-204.
Qureshi, C., Harris, E., & Atkinson, B. E. (2016). Relationships between age of females and attraction to the Dark Triad personality. Personality and Individual Differences, 95, 200-203.
2 comments
A lot of the taboo over age gaps is cultural. Seriously, read some anthropology and you’ll realise how much values, taboos and social attitudes vary around the world.
Dating and marrying kids is just about the biggest taboo in modern Western societies but in many traditional foraging societies it’s completely normal. As an exmaple, in the well-studied Yanomamo tribe most of the girls are married off before they’re 14 to adult men and it’s common for men to court girls as young as about 6. If there’s a girl you find attractive and want to have for yourself you’d go and sit with her family group, chat with them and their girl, try to impress her with gifts and jokes etc. If you get on together and her parents like you, you’d officially become a couple.
When the anthropologist Kenneth Good lived in this tribe in his 30s he met and started dating a girl about 9 called Yarima. They got on well and the other people in the tribe accepted them as man and wife. They began having sex a few years later when she came into puberty and “ripened” as the Yanomamo put it.
Here in the West people are shocked and disgusted by these marriages between adult men and little girls and think a society that allows them is strange. But really it’s our society that’s strange for not having these practices. This is part of the natural mating system for our species. Because we form long-term bonds it’s in a man’s biological interests to secure females when they’re young and haven’t reached reproductive age yet in order to stand a chance at capturing all their fertile years.
Just a small suggestion: For the scatter plot of participant age by ideal partner age, it might be helpful to make the plot a square with an additional line going through the diagonal. It would help show what the trend would look like if people preferred exactly their own age.