Enjoy DatePsychology? Consider subscribing at Patreon to support the project.
I recently administered a short statistics and methodology quiz. How well did DatePsychology readers do, did self-assessed confidence predict quiz performance, and do we see evidence of a Dunning-Kruger effect (less knowledgeable participants assessing their own scores higher)?
Methodology
I collected a sample of 260 participants (17% female) through a social media convenience / snowball sample. I asked participants “are you blackpilled” (YES/NO) and “have you had sex within the last two years” (YES/NO). I also asked participants “how confident are you in your own ability to assess and interpret research statistics and methodology,” rated on a 1-7 Likert scale.
Participants were presented with four short vignettes describing a study and were asked (1) how well they trusted the methodology of the study and (2) how believable they found the result of the study.
I administered a short TRUE/FALSE quiz with some statistics and methodology questions. (Try to answer these in your mind. I will explain the correct answers in a section below.)
- Everything in nature falls on a normal distribution.
- A p-value tells you the size of an effect; the smaller the p-value, the bigger your effect.
- When there is a correlation, there is no causal relationship between variables.
- Outliers must always be removed from your data.
- A larger sample size is more representative.
- If your result is not statistically significant, this means the null hypothesis is true.
- A confidence interval is the probability that the true population parameter will fall within the range of the interval.
- Group A has a higher average score than Group B. This means that a person taken randomly from Group A is more likely to have a higher score than a person taken randomly from Group B.
I also submitted these questions to ChatGPT with the prompt “Is this true or false:” followed by the question as presented above.
Results
ChatGPT
ChatGPT provided the correct answer to 7 out of 8 questions. On a second attempt, ChatGPT provided the correct answer to 7 out of 8 questions — but the incorrect answer was different. Not too bad.
Sample Scores
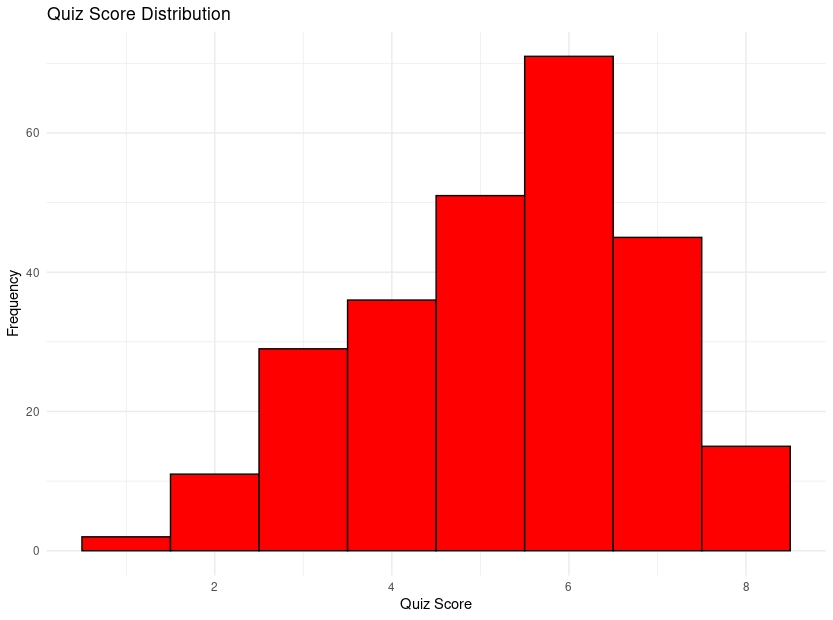
The average score across the full sample was a 5.27 out of 8. 15 participants got all 8 answers correct. Below is a distribution of the scores:
Confidence, Trust, Belief, and Quiz Scores
There was no statistically significant association between self-confidence in statistical ability and quiz scores (r = 0.054, p = p = 0.385, 95% CI [-0.068, 0.175]). There was also no significant association between study trust and quiz scores (r = -0.076, p = 0.224, 95% CI [-0.195, 0.046]), nor study belief and quiz scores (r = -0.077, p = 0.218, 95% CI [-0.197, 0.045]).
However, self-assessed confidence in statistics and methodology predicted higher trust in study vignettes (r = 0.136, p = 0.028, 95% CI [0.015, 0.254]) and higher belief in the results of the study vignettes (r = 0.179, p = 0.004, 95% CI [0.059, 0.294]).
Sex and Age Difference in Scores, Trust, and Belief.
There was a significant negative association between participant age and study trust (r = -0.213, p = 0.001, 95% CI [-0.326, -0.094]) and a significant negative association between participant age and study belief (r = -0.169, p = 0.006, 95% CI [-0.285, -0.048]). However, the correlation between age and self-assessed confidence in statistical methodology was not significant (r = -0.003, p = 0.957, 95% CI [-0.125, 0.118]), nor was the association between participant age and quiz scores (r = 0.063, p = 0.308, 95% CI [-0.059, 0.184]). Participants who were younger trusted study vignette methodology less and believed the results less on average, but did not perform higher on the statistics quiz nor did they assess their own confidence higher.
There was a statistically significant difference in quiz scores by sex (t = 2.602, df = 59, p = 0.012, d = .45). The 95% confidence interval for the mean difference ranged from 0.169 to 1.297, with a mean of 5.40 for men and 4.67 for women. Men scored higher than women on the statistics quiz on average. However, there were no significant sex differences for study trust, study belief, or self-assessed confidence (all ps > .05).
Blackpiller & Celibate Scores, Trust, and Belief
Comparing participants who identified as “blackpilled” versus those who did not, a statistically significant difference in quiz scores was observed (t = -2.305, df = 35.424, p = 0.027, CI [-1.195, -0.076], d = -.43). The mean quiz score was 4.70 for “blackpilled” participants and 5.34 for those who were not. There was no statistically significant difference between groups in study belief, study trust, or self-assessed confidence (all ps > .05).
There was also no statistically significant difference in quiz scores, study belief, study trust, and self-assessed confidence between participants who have had sex within the last two years and those who have not (all ps > .05).
Dunning-Kruger Effect
An analysis of variance (ANOVA) was conducted to examine the relationship between grouped quiz scores (Low, Medium, High) and participants’ self-assessed confidence ratings. The results revealed no statistically significant differences in confidence ratings among the quiz score groups, (F(2, 257) = 0.302, p = 0.739). Descriptive statistics indicated that the mean confidence rating for the “Low” group was 4.77, for the “Medium” group was 4.56, and for the “High” group was 4.68.
The range for the “Low” group was 1-2, the “Medium” group was 3-5, and the “High” group was 6-7. The average scores across these groups was 1.85, 4.89, and 7.25 respectively. Participants who scored low on the quiz assessed their own confidence higher than it should be (1.85 vs 4.77), while participants who scored high on the quiz assessed their own confidence as lower than their scores reflected (7.25 vs 4.68).
Question Answers
The correct answer to all eight questions is FALSE. Here is why:
- Everything in nature falls on a normal distribution.
I think people may have formed this belief from learning about the central limit theorem (CLT) in early statistics classes, where sampling distributions tend to form normal distributions from non-normal populations. In nature, however, we see distributions of many types: bimodal, multimodal, and Pareto, among others. It’s not necessarily even the case that the normal distribution is the most common distribution in nature. Pareto and skewed distributions are very common. Discrete traits (eye color, sex) also do not form normal distributions.
- A p-value tells you the size of an effect; the smaller the p-value, the bigger your effect.
A p-value is not a measure of effect size. A p-value tells you the probability of obtaining the result if the null hypothesis were true. Effect sizes quantify the magnitude, size, or strength of the relationship between variables, or the difference between groups.
- When there is a correlation, there is no causal relationship between variables.
We have all heard the phrase correlation does not equal causation. However, this does not mean that when a correlation exists a causal relationship does not. If variable X produces a change in variable Y, you will observe a correlation, but the relationship between X and Y is also causal. A classic example of this is cigarette smoking. The correlation between smoking and lung cancer was observed well before causal evidence emerged, but it did indeed turn out that smoking causes cancer.
- Outliers must always be removed from your data.
There is no rule that outliers must always be removed. As a researcher, you should be able to justify why removing outliers was appropriate in your case and you should be able to determine what effect the removal has on your analysis. In some cases, outliers will not shift your result much. In other cases, the removal of data points may bias your results. Statistical measurements like quantile-quantile (Q-Q) plots, Cook’s distance, Mahalanobis distance, and leverage points can help you identify outliers and what effect removing an outlier may have.
- A larger sample size is more representative.
Representativeness is derived from your sampling method rather than your sample size. While a sample can be too small to be representative (imagine an N of 4), a large sample that is not randomly selected from the population of interest will not be more representative as the sample size is increased. A large sample may even inflate bias.
- If your result is not statistically significant, this means the null hypothesis is true.
In null hypothesis significance testing you may only reject the null hypothesis; you do not provide evidence for it. When a result is statistically significant, you may reject the null hypothesis and provide evidence for the alternative hypothesis. However, when a result is not statistically significant you do not provide evidence in favor of the null hypothesis being true.
- A confidence interval is the probability that the true population parameter will fall within the range of the interval.
A confidence interval is not a statement about the probability of the population parameter falling within the range provided. Rather, “the formal meaning of a confidence interval is that 95% of the confidence intervals should, in the long run, contain the true population parameter.” If you continue to draw new samples from the same population over time, with a 95% confidence interval then 95% of those will contain the true population parameter.
- Group A has a higher average score than Group B. This means that a person taken randomly from Group A is more likely to have a higher score than a person taken randomly from Group B.
The means of groups don’t tell you the distribution of groups, nor where individuals may fall. What if a distribution is skewed or bimodal? You might actually have more individuals in Group B with a higher score than the mean in Group A. Related to this is the ecological fallacy in statistics: group means don’t give you certain information about where individuals within groups reside and should not be used to make inferences about individuals within groups.
Discussion
Statistics quiz scores did not predict trust of study methodology nor belief in study results. Additionally, quiz scores did not predict self-confidence in statistical methodology. However, participants who had higher self-confidence in interpreting study methodology were more likely to trust the methodology and results presented in the study vignettes.
Younger participants were also less likely to trust study methodology and believe study results. However, younger participants did not score better on the quiz nor did they self-assess their own confidence higher or lower.
Men performed better on the stats quiz, as did participants who indicated they were not “blackpilled.” There was no significant difference between the “blackpilled” group and the non-”blackpilled” group in study trust, belief, and self-assessed confidence, although the effects were in the expected direction. “Blackpilled” participants scored lower in study trust (17.4 vs 18.6) and study result belief (17.1 vs 18), as well as higher in self-assessed confidence (4.9 vs 4.6). With only 30 “blackpilled” participants this may be underpowered to detect effects that are not large.
No difference was observed between Low, Medium, and High quiz scores and self-assessed confidence. Recent research has called the Dunning-Kruger effect into question, but we do see an effect here where participants low in statistical and methodological knowledge assessed their own confidence higher than it should be, while participants who scored highly on the quiz assessed their own confidence lower than their scores reflected.
Ultimately, participants did pretty well on the stats quiz. In a survey of medical doctors, across 9 basic statistical questions the median score was 4 and 2.9 in the random sample (Wulff et al., 1987). Another survey of medical residents found an average score of 41% in interpreting research results (Windish et al., 2007). A probability sample drawn from 27 nursing schools found an average score of 5.1 out of 8 questions (Hayat et al., 2021). A study of anesthesiologists found only 15% could correctly answer a question on p-values, 28% could correctly answer a question on confidence intervals, and 52% correctly answered a question on correlation (Schober et al., 2017). A survey of pharmacists found 62% correctly responded to questions on statistical tests and 50% could distinguish between statistical significance and clinical significance (Ferrill et al., 1999). In another survey of critical care physicians, 62% failed a 25-item assessment on p-values (Andreu et al., 2021). So if you didn’t get most of these right don’t worry — you can still be a doctor.
References
Andreu, M. F., Ballve, L. P. D., Verdecchia, D. H., Monzón, A. M., & Carvalho, T. D. D. (2021). Is the p-value properly interpreted by critical care professionals? Online survey. Revista Brasileira de Terapia Intensiva, 33, 88-95.
Ferrill, M. J., Norton, L. L., & Blalock, S. J. (1999). Determining the statistical knowledge of pharmacy practitioners: a survey and review of the literature. American journal of pharmaceutical education, 63(4), 371-376.
Hayat, M. J., Kim, M., Schwartz, T. A., & Jiroutek, M. R. (2021). A study of statistics knowledge among nurse faculty in schools with research doctorate programs. Nursing Outlook, 69(2), 228-233.
Schober, P., Bossers, S. M., Dong, P. V., Boer, C., & Schwarte, L. A. (2017). What do anesthesiologists know about p values, confidence intervals, and correlations: a pilot survey. Anesthesiology Research and Practice, 2017.
Windish, D. M., Huot, S. J., & Green, M. L. (2007). Medicine residents’ understanding of the biostatistics and results in the medical literature. Jama, 298(9), 1010-1022.
Wulff, H. R., Andersen, B., Brandenhoff, P., & Guttler, F. (1987). What do doctors know about statistics?. Statistics in medicine, 6(1), 3-10.
4 comments
How exactly is the statement in question 8 not a valid probabilistic inference given the scenario presented?
For example: Given well established average height differences between men and women, would I be committing an ecological fallacy by asserting that a randomly selected man is likely to be taller than a randomly selected woman?
Addendum: You mentioned “group means don’t give you certain information about where individuals within groups reside”
This statement is almost self-evidently true, yet this isn’t even in contention. The question really is: Do group means give you ANY information about individuals within said groups. You do not necessarily need to have certainty in order to make valid inferences. Given the scenario presented in my previous comment, how exactly is this not a valid probabilistic inference?
I am a blackpilled incel with no background in stats yet I still scored 8/8. I admit that I hesitated for items 6 and 7, however when I noticed the rest was all FALSE I correctly assumed all were in fact false.
The statement in point 5 might not be well-suited to a binary response format because it lacks a qualifier like “always,” which allows for its interpretation as a general statement. If we define “representative” as “reflective of the ground truth,” then point 5 is true in all scenarios where endogeneity is not an issue. This is evident in test value calculations, where noise is generally divided by the sample size or a function thereof. Thus, the most appropriate answer to point 5 would be “it depends.”
A similar argument could be made for point 8. However, in this case, the claim to universality appears to be more pronounced, which is why I think it can stay as it is.